Supported by Dr. Osamu Ogasawara and  . . |
|
Last data update: 2014.03.03 |
GeneRegionTrack class and methodsDescriptionA class to hold gene model data for a genomic region. Usage
GeneRegionTrack(range=NULL, rstarts=NULL, rends=NULL, rwidths=NULL,
               strand, feature, exon, transcript, gene, symbol,
               chromosome, genome, stacking="squish",
               name="GeneRegionTrack", start=NULL, end=NULL,
               importFunction, stream=FALSE, ...)
ArgumentsSince
DetailsA track containing all gene models in a particular region. The data
are usually fetched dynamially from an online data store, but it is
also possible to manully construct objects from local
data. Connections to particular online data sources should be
implemented as sub-classes, and
ValueThe return value of the constructor function is a new object of class
Objects from the classObjects can be created using the constructor function
Slots
ExtendsClass Class Class Class MethodsIn the following code chunks, Exported in the name space:
Internal methods:
Inherited methods:
Display ParametersThe following display parameters are set for objects of class
Additional display parameters are being inherited from the respective
parent classes. Note that not all of them may have an effect on the
plotting of
Author(s)Florian Hahne, Steve Lianoglou See Also
Examples
## The empty object
GeneRegionTrack()
## Load some sample data
data(cyp2b10)
## Construct the object
grTrack <- GeneRegionTrack(start=26682683, end=26711643,
rstart=cyp2b10$start, rends=cyp2b10$end, chromosome=7, genome="mm9",
transcript=cyp2b10$transcript, gene=cyp2b10$gene, symbol=cyp2b10$symbol,
feature=cyp2b10$feature, exon=cyp2b10$exon,
name="Cyp2b10", strand=cyp2b10$strand)
## Directly from the data.frame
grTrack <- GeneRegionTrack(cyp2b10)
## From a TxDb object
if(require(GenomicFeatures)){
samplefile <- system.file("extdata", "hg19_knownGene_sample.sqlite", package="GenomicFeatures")
txdb <- loadDb(samplefile)
GeneRegionTrack(txdb)
GeneRegionTrack(txdb, chromosome="chr6", start=35000000, end=40000000)
}
## Plotting
plotTracks(grTrack)
## Track names
names(grTrack)
names(grTrack) <- "foo"
plotTracks(grTrack)
## Subsetting and splitting
subTrack <- subset(grTrack, from=26700000, to=26705000)
length(subTrack)
subTrack <- grTrack[transcript(grTrack)=="ENSMUST00000144140"]
split(grTrack, transcript(grTrack))
## Accessors
start(grTrack)
end(grTrack)
width(grTrack)
position(grTrack)
width(subTrack) <- width(subTrack)+100
strand(grTrack)
strand(subTrack) <- "-"
chromosome(grTrack)
chromosome(subTrack) <- "chrX"
genome(grTrack)
genome(subTrack) <- "hg19"
range(grTrack)
ranges(grTrack)
## Annotation
identifier(grTrack)
identifier(grTrack, "lowest")
identifier(subTrack) <- "bar"
feature(grTrack)
feature(subTrack) <- "foo"
exon(grTrack)
exon(subTrack) <- letters[1:2]
gene(grTrack)
gene(subTrack) <- "bar"
symbol(grTrack)
symbol(subTrack) <- "foo"
transcript(grTrack)
transcript(subTrack) <- c("foo", "bar")
chromosome(subTrack) <- "chr7"
plotTracks(subTrack)
values(grTrack)
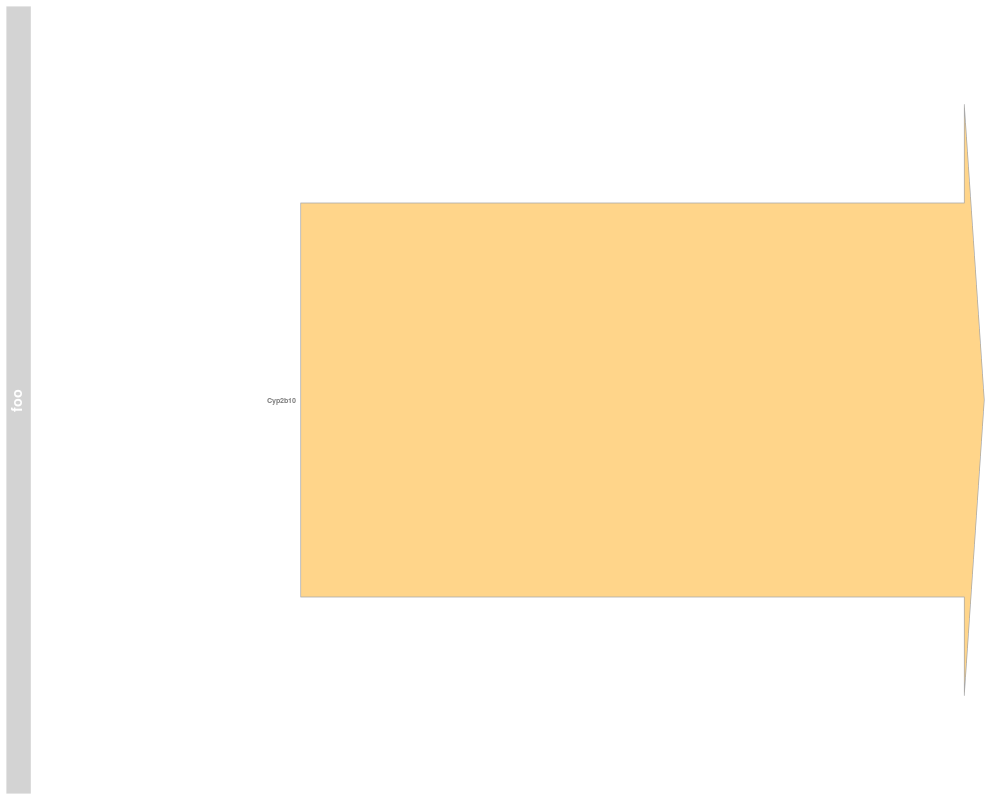
## Grouping
group(grTrack)
group(subTrack) <- "Group 1"
transcript(subTrack)
plotTracks(subTrack)
## Collapsing transcripts
plotTracks(grTrack, collapseTranscripts=TRUE, showId=TRUE,
extend.left=10000, shape="arrow")
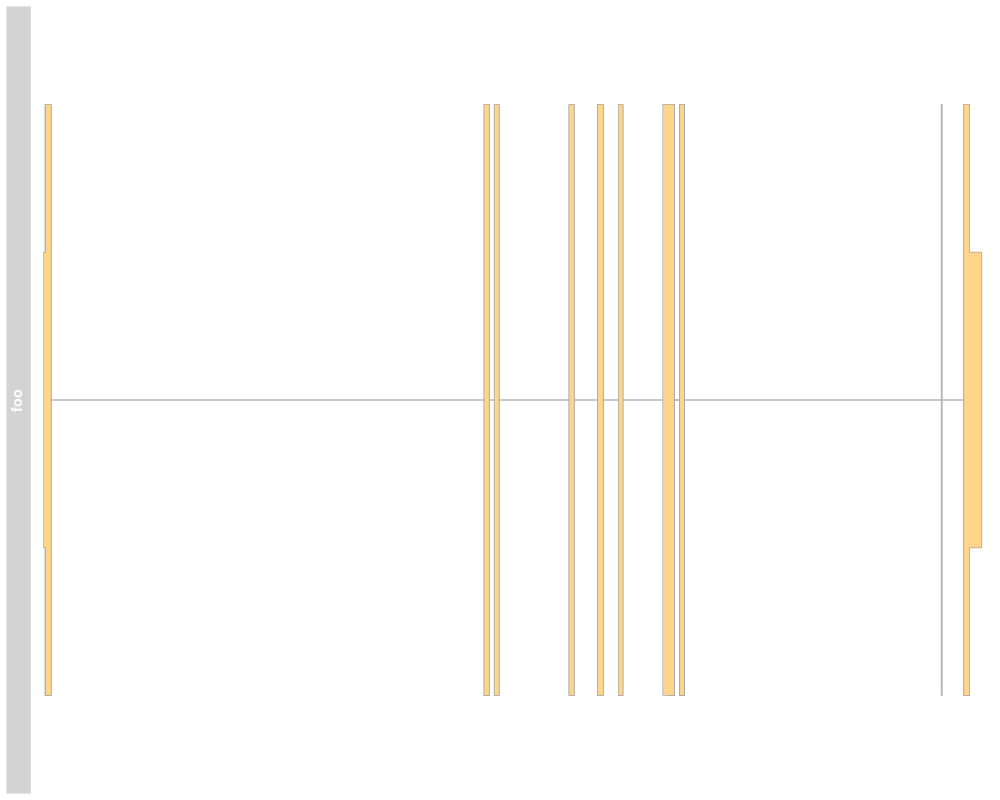
## Stacking
stacking(grTrack)
stacking(grTrack) <- "dense"
plotTracks(grTrack)
## coercion
as(grTrack, "data.frame")
as(grTrack, "UCSCData")
## HTML image map
coords(grTrack)
tags(grTrack)
grTrack <- plotTracks(grTrack)$foo
coords(grTrack)
tags(grTrack)
Results
R version 3.3.1 (2016-06-21) -- "Bug in Your Hair"
Copyright (C) 2016 The R Foundation for Statistical Computing
Platform: x86_64-pc-linux-gnu (64-bit)
R is free software and comes with ABSOLUTELY NO WARRANTY.
You are welcome to redistribute it under certain conditions.
Type 'license()' or 'licence()' for distribution details.
R is a collaborative project with many contributors.
Type 'contributors()' for more information and
'citation()' on how to cite R or R packages in publications.
Type 'demo()' for some demos, 'help()' for on-line help, or
'help.start()' for an HTML browser interface to help.
Type 'q()' to quit R.
> library(Gviz)
Loading required package: S4Vectors
Loading required package: stats4
Loading required package: BiocGenerics
Loading required package: parallel
Attaching package: 'BiocGenerics'
The following objects are masked from 'package:parallel':
clusterApply, clusterApplyLB, clusterCall, clusterEvalQ,
clusterExport, clusterMap, parApply, parCapply, parLapply,
parLapplyLB, parRapply, parSapply, parSapplyLB
The following objects are masked from 'package:stats':
IQR, mad, xtabs
The following objects are masked from 'package:base':
Filter, Find, Map, Position, Reduce, anyDuplicated, append,
as.data.frame, cbind, colnames, do.call, duplicated, eval, evalq,
get, grep, grepl, intersect, is.unsorted, lapply, lengths, mapply,
match, mget, order, paste, pmax, pmax.int, pmin, pmin.int, rank,
rbind, rownames, sapply, setdiff, sort, table, tapply, union,
unique, unsplit
Attaching package: 'S4Vectors'
The following objects are masked from 'package:base':
colMeans, colSums, expand.grid, rowMeans, rowSums
Loading required package: IRanges
Loading required package: GenomicRanges
Loading required package: GenomeInfoDb
Loading required package: grid
> png(filename="/home/ddbj/snapshot/RGM3/R_BC/result/Gviz/GeneRegionTrack-class.Rd_%03d_medium.png", width=480, height=480)
> ### Name: GeneRegionTrack-class
> ### Title: GeneRegionTrack class and methods
> ### Aliases: GeneRegionTrack-class GeneRegionTrack
> ### coerce,GeneRegionTrack,UCSCData-method
> ### collapseTrack,GeneRegionTrack-method exon exon,GeneRegionTrack-method
> ### exon<- exon<-,GeneRegionTrack,character-method
> ### gene,GeneRegionTrack-method gene
> ### gene<-,GeneRegionTrack,character-method gene<-
> ### group,GeneRegionTrack-method group<-,GeneRegionTrack,character-method
> ### identifier,GeneRegionTrack-method
> ### identifier<-,GeneRegionTrack,character-method
> ### initialize,GeneRegionTrack-method
> ### initialize,ReferenceGeneRegionTrack-method
> ### show,GeneRegionTrack-method show,ReferenceGeneRegionTrack-method
> ### symbol,GeneRegionTrack-method
> ### symbol<-,GeneRegionTrack,character-method symbol symbol<-
> ### transcript,GeneRegionTrack-method
> ### transcript<-,GeneRegionTrack,character-method transcript transcript<-
> ### coerce,GRanges,GeneRegionTrack-method
> ### coerce,GRangesList,GeneRegionTrack-method
> ### coerce,TxDb,GeneRegionTrack-method
> ### subset,ReferenceGeneRegionTrack-method
> ### Keywords: classes
>
> ### ** Examples
>
>
> ## The empty object
> GeneRegionTrack()
GeneRegionTrack 'GeneRegionTrack'
| genome: NA
| active chromosome: chrNA
| annotation features: 0
>
> ## Load some sample data
> data(cyp2b10)
>
> ## Construct the object
> grTrack <- GeneRegionTrack(start=26682683, end=26711643,
+ rstart=cyp2b10$start, rends=cyp2b10$end, chromosome=7, genome="mm9",
+ transcript=cyp2b10$transcript, gene=cyp2b10$gene, symbol=cyp2b10$symbol,
+ feature=cyp2b10$feature, exon=cyp2b10$exon,
+ name="Cyp2b10", strand=cyp2b10$strand)
>
> ## Directly from the data.frame
> grTrack <- GeneRegionTrack(cyp2b10)
>
> ## From a TxDb object
> if(require(GenomicFeatures)){
+ samplefile <- system.file("extdata", "hg19_knownGene_sample.sqlite", package="GenomicFeatures")
+ txdb <- loadDb(samplefile)
+ GeneRegionTrack(txdb)
+ GeneRegionTrack(txdb, chromosome="chr6", start=35000000, end=40000000)
+ }
Loading required package: GenomicFeatures
Loading required package: AnnotationDbi
Loading required package: Biobase
Welcome to Bioconductor
Vignettes contain introductory material; view with
'browseVignettes()'. To cite Bioconductor, see
'citation("Biobase")', and for packages 'citation("pkgname")'.
GeneRegionTrack 'GeneRegionTrack'
| genome: hg19
| active chromosome: chr6
| annotation features: 71
>
>
>
> ## Don't show:
> ## For some annoying reason the postscript device does not know about
> ## the sans font
> #if(!interactive())
> #{
> font <- ps.options()$family
> displayPars(grTrack) <- list(fontfamily=font, fontfamily.title=font)
> #}
> ## End(Don't show)
>
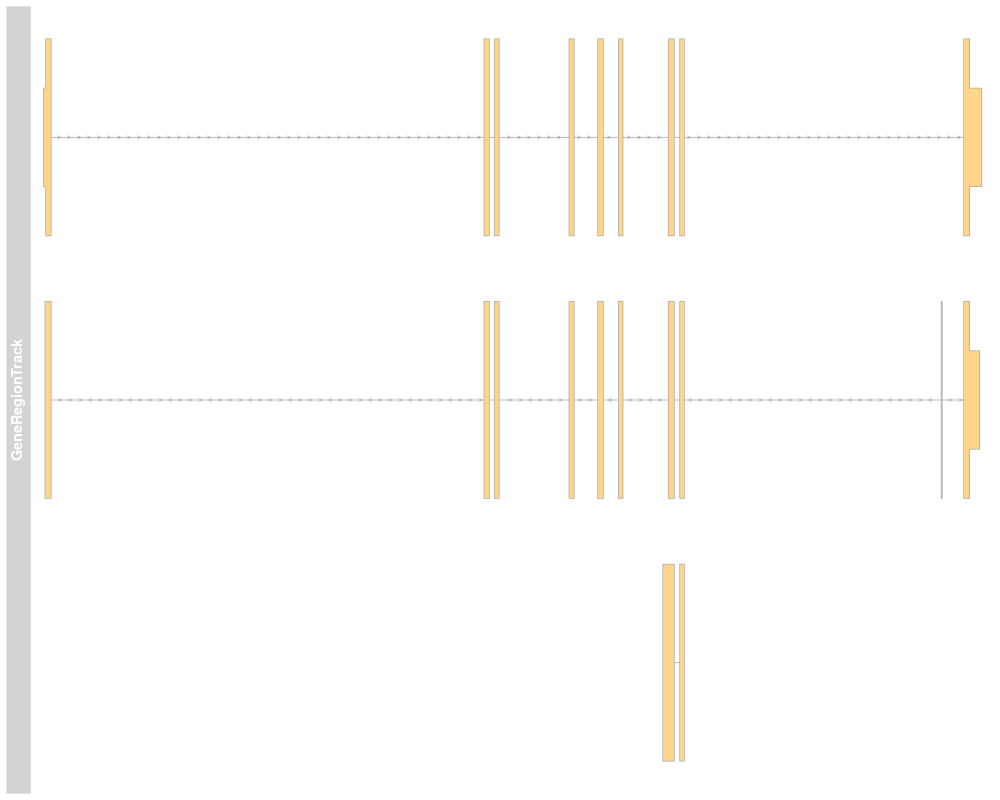
> ## Plotting
> plotTracks(grTrack)
>
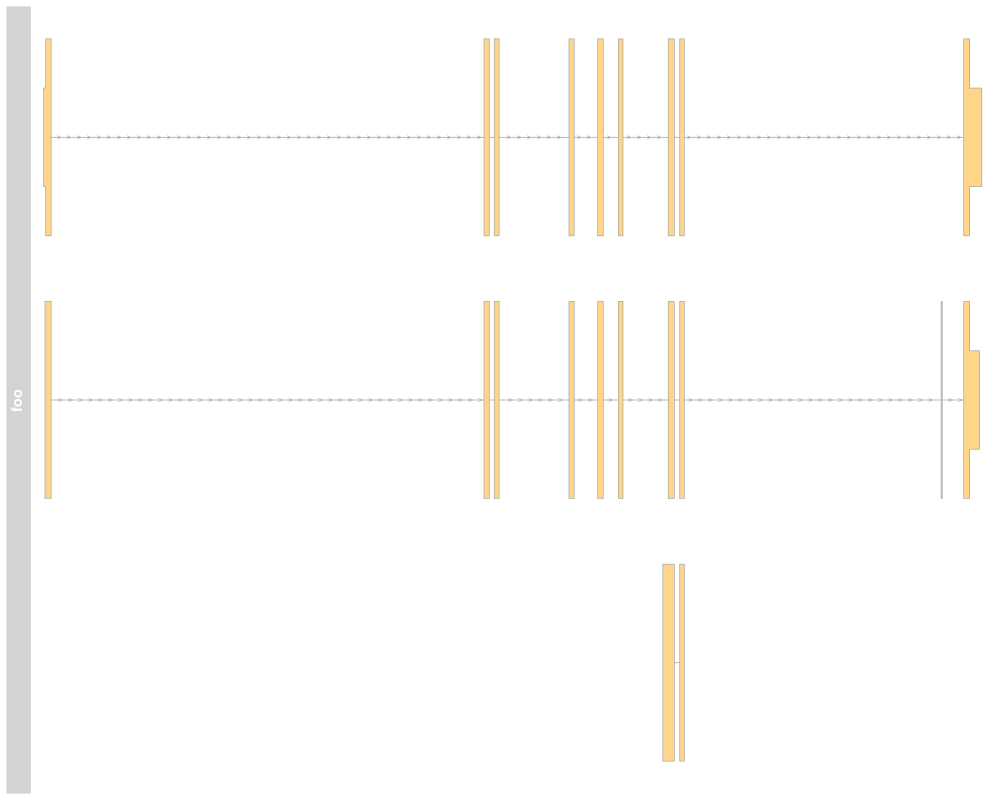
> ## Track names
> names(grTrack)
[1] "GeneRegionTrack"
> names(grTrack) <- "foo"
> plotTracks(grTrack)
>
> ## Subsetting and splitting
> subTrack <- subset(grTrack, from=26700000, to=26705000)
> length(subTrack)
[1] 0
> subTrack <- grTrack[transcript(grTrack)=="ENSMUST00000144140"]
> split(grTrack, transcript(grTrack))
$ENSMUST00000005477
GeneRegionTrack 'foo'
| genome: NA
| active chromosome: chr7
| annotation features: 12
$ENSMUST00000072438
GeneRegionTrack 'foo'
| genome: NA
| active chromosome: chr7
| annotation features: 11
$ENSMUST00000144140
GeneRegionTrack 'foo'
| genome: NA
| active chromosome: chr7
| annotation features: 2
>
> ## Accessors
> start(grTrack)
[1] 25897620 25897676 25897685 25897685 25911238 25911238 25911554 25911554
[9] 25913865 25913865 25914748 25914748 25915392 25915392 25916766 25916934
[17] 25916934 25917288 25917288 25917288 25925373 25926068 25926068 25926250
[25] 25926250
> end(grTrack)
[1] 25897684 25897684 25897855 25897855 25911400 25911400 25911703 25911703
[9] 25914025 25914025 25914924 25914924 25915533 25915533 25917121 25917121
[17] 25917121 25917429 25917429 25917430 25925399 25926249 25926249 25926559
[25] 25926624
> width(grTrack)
[1] 65 9 171 171 163 163 150 150 161 161 177 177 142 142 356 188 188 142 142
[20] 143 27 182 182 310 375
> position(grTrack)
[1] 25897652 25897680 25897770 25897770 25911319 25911319 25911628 25911628
[9] 25913945 25913945 25914836 25914836 25915462 25915462 25916944 25917028
[17] 25917028 25917358 25917358 25917359 25925386 25926158 25926158 25926404
[25] 25926437
> width(subTrack) <- width(subTrack)+100
>
> strand(grTrack)
[1] "+" "+" "+" "+" "+" "+" "+" "+" "+" "+" "+" "+" "+" "+" "+" "+" "+" "+" "+"
[20] "+" "+" "+" "+" "+" "+"
> strand(subTrack) <- "-"
>
> chromosome(grTrack)
[1] "chr7"
> chromosome(subTrack) <- "chrX"
>
> genome(grTrack)
[1] NA
> genome(subTrack) <- "hg19"
>
> range(grTrack)
IRanges object with 25 ranges and 0 metadata columns:
start end width
<integer> <integer> <integer>
[1] 25897620 25897684 65
[2] 25897676 25897684 9
[3] 25897685 25897855 171
[4] 25897685 25897855 171
[5] 25911238 25911400 163
... ... ... ...
[21] 25925373 25925399 27
[22] 25926068 25926249 182
[23] 25926068 25926249 182
[24] 25926250 25926559 310
[25] 25926250 25926624 375
> ranges(grTrack)
GRanges object with 25 ranges and 7 metadata columns:
seqnames ranges strand | feature id
<Rle> <IRanges> <Rle> | <factor> <character>
[1] chr7 [25897620, 25897684] + | utr5 unknown
[2] chr7 [25897676, 25897684] + | utr5 unknown
[3] chr7 [25897685, 25897855] + | protein_coding unknown
[4] chr7 [25897685, 25897855] + | protein_coding unknown
[5] chr7 [25911238, 25911400] + | protein_coding unknown
... ... ... ... . ... ...
[21] chr7 [25925373, 25925399] + | protein_coding unknown
[22] chr7 [25926068, 25926249] + | protein_coding unknown
[23] chr7 [25926068, 25926249] + | protein_coding unknown
[24] chr7 [25926250, 25926559] + | utr3 unknown
[25] chr7 [25926250, 25926624] + | utr3 unknown
exon transcript gene symbol
<factor> <factor> <factor> <factor>
[1] ENSMUSE00000742021 ENSMUST00000072438 ENSMUSG00000030483 Cyp2b10
[2] ENSMUSE00000489385 ENSMUST00000005477 ENSMUSG00000030483 Cyp2b10
[3] ENSMUSE00000742021 ENSMUST00000072438 ENSMUSG00000030483 Cyp2b10
[4] ENSMUSE00000489385 ENSMUST00000005477 ENSMUSG00000030483 Cyp2b10
[5] ENSMUSE00000973560 ENSMUST00000072438 ENSMUSG00000030483 Cyp2b10
... ... ... ... ...
[21] ENSMUSE00000496705 ENSMUST00000005477 ENSMUSG00000030483 Cyp2b10
[22] ENSMUSE00000498616 ENSMUST00000072438 ENSMUSG00000030483 Cyp2b10
[23] ENSMUSE00000750625 ENSMUST00000005477 ENSMUSG00000030483 Cyp2b10
[24] ENSMUSE00000750625 ENSMUST00000005477 ENSMUSG00000030483 Cyp2b10
[25] ENSMUSE00000498616 ENSMUST00000072438 ENSMUSG00000030483 Cyp2b10
density
<numeric>
[1] 1
[2] 1
[3] 1
[4] 1
[5] 1
... ...
[21] 1
[22] 1
[23] 1
[24] 1
[25] 1
-------
seqinfo: 1 sequence from an unspecified genome; no seqlengths
>
> ## Annotation
> identifier(grTrack)
[1] "Cyp2b10" "Cyp2b10" "Cyp2b10" "Cyp2b10" "Cyp2b10" "Cyp2b10" "Cyp2b10"
[8] "Cyp2b10" "Cyp2b10" "Cyp2b10" "Cyp2b10" "Cyp2b10" "Cyp2b10" "Cyp2b10"
[15] "Cyp2b10" "Cyp2b10" "Cyp2b10" "Cyp2b10" "Cyp2b10" "Cyp2b10" "Cyp2b10"
[22] "Cyp2b10" "Cyp2b10" "Cyp2b10" "Cyp2b10"
> identifier(grTrack, "lowest")
[1] "ENSMUSE00000742021" "ENSMUSE00000489385" "ENSMUSE00000742021"
[4] "ENSMUSE00000489385" "ENSMUSE00000973560" "ENSMUSE00000973560"
[7] "ENSMUSE00001043622" "ENSMUSE00001043622" "ENSMUSE00001013991"
[10] "ENSMUSE00001013991" "ENSMUSE00000996531" "ENSMUSE00000996531"
[13] "ENSMUSE00000999790" "ENSMUSE00000999790" "ENSMUSE00000736922"
[16] "ENSMUSE00000963884" "ENSMUSE00000963884" "ENSMUSE00001063063"
[19] "ENSMUSE00001063063" "ENSMUSE00000748299" "ENSMUSE00000496705"
[22] "ENSMUSE00000498616" "ENSMUSE00000750625" "ENSMUSE00000750625"
[25] "ENSMUSE00000498616"
> identifier(subTrack) <- "bar"
>
> feature(grTrack)
[1] "utr5" "utr5" "protein_coding" "protein_coding"
[5] "protein_coding" "protein_coding" "protein_coding" "protein_coding"
[9] "protein_coding" "protein_coding" "protein_coding" "protein_coding"
[13] "protein_coding" "protein_coding" "protein_coding" "protein_coding"
[17] "protein_coding" "protein_coding" "protein_coding" "protein_coding"
[21] "protein_coding" "protein_coding" "protein_coding" "utr3"
[25] "utr3"
> feature(subTrack) <- "foo"
>
> exon(grTrack)
[1] "ENSMUSE00000742021" "ENSMUSE00000489385" "ENSMUSE00000742021"
[4] "ENSMUSE00000489385" "ENSMUSE00000973560" "ENSMUSE00000973560"
[7] "ENSMUSE00001043622" "ENSMUSE00001043622" "ENSMUSE00001013991"
[10] "ENSMUSE00001013991" "ENSMUSE00000996531" "ENSMUSE00000996531"
[13] "ENSMUSE00000999790" "ENSMUSE00000999790" "ENSMUSE00000736922"
[16] "ENSMUSE00000963884" "ENSMUSE00000963884" "ENSMUSE00001063063"
[19] "ENSMUSE00001063063" "ENSMUSE00000748299" "ENSMUSE00000496705"
[22] "ENSMUSE00000498616" "ENSMUSE00000750625" "ENSMUSE00000750625"
[25] "ENSMUSE00000498616"
> exon(subTrack) <- letters[1:2]
>
> gene(grTrack)
[1] "ENSMUSG00000030483" "ENSMUSG00000030483" "ENSMUSG00000030483"
[4] "ENSMUSG00000030483" "ENSMUSG00000030483" "ENSMUSG00000030483"
[7] "ENSMUSG00000030483" "ENSMUSG00000030483" "ENSMUSG00000030483"
[10] "ENSMUSG00000030483" "ENSMUSG00000030483" "ENSMUSG00000030483"
[13] "ENSMUSG00000030483" "ENSMUSG00000030483" "ENSMUSG00000030483"
[16] "ENSMUSG00000030483" "ENSMUSG00000030483" "ENSMUSG00000030483"
[19] "ENSMUSG00000030483" "ENSMUSG00000030483" "ENSMUSG00000030483"
[22] "ENSMUSG00000030483" "ENSMUSG00000030483" "ENSMUSG00000030483"
[25] "ENSMUSG00000030483"
> gene(subTrack) <- "bar"
>
> symbol(grTrack)
[1] "Cyp2b10" "Cyp2b10" "Cyp2b10" "Cyp2b10" "Cyp2b10" "Cyp2b10" "Cyp2b10"
[8] "Cyp2b10" "Cyp2b10" "Cyp2b10" "Cyp2b10" "Cyp2b10" "Cyp2b10" "Cyp2b10"
[15] "Cyp2b10" "Cyp2b10" "Cyp2b10" "Cyp2b10" "Cyp2b10" "Cyp2b10" "Cyp2b10"
[22] "Cyp2b10" "Cyp2b10" "Cyp2b10" "Cyp2b10"
> symbol(subTrack) <- "foo"
>
> transcript(grTrack)
[1] "ENSMUST00000072438" "ENSMUST00000005477" "ENSMUST00000072438"
[4] "ENSMUST00000005477" "ENSMUST00000072438" "ENSMUST00000005477"
[7] "ENSMUST00000072438" "ENSMUST00000005477" "ENSMUST00000072438"
[10] "ENSMUST00000005477" "ENSMUST00000072438" "ENSMUST00000005477"
[13] "ENSMUST00000072438" "ENSMUST00000005477" "ENSMUST00000144140"
[16] "ENSMUST00000072438" "ENSMUST00000005477" "ENSMUST00000072438"
[19] "ENSMUST00000005477" "ENSMUST00000144140" "ENSMUST00000005477"
[22] "ENSMUST00000072438" "ENSMUST00000005477" "ENSMUST00000005477"
[25] "ENSMUST00000072438"
> transcript(subTrack) <- c("foo", "bar")
> chromosome(subTrack) <- "chr7"
> plotTracks(subTrack)
>
> values(grTrack)
feature id exon transcript
1 utr5 unknown ENSMUSE00000742021 ENSMUST00000072438
2 utr5 unknown ENSMUSE00000489385 ENSMUST00000005477
3 protein_coding unknown ENSMUSE00000742021 ENSMUST00000072438
4 protein_coding unknown ENSMUSE00000489385 ENSMUST00000005477
5 protein_coding unknown ENSMUSE00000973560 ENSMUST00000072438
6 protein_coding unknown ENSMUSE00000973560 ENSMUST00000005477
7 protein_coding unknown ENSMUSE00001043622 ENSMUST00000072438
8 protein_coding unknown ENSMUSE00001043622 ENSMUST00000005477
9 protein_coding unknown ENSMUSE00001013991 ENSMUST00000072438
10 protein_coding unknown ENSMUSE00001013991 ENSMUST00000005477
11 protein_coding unknown ENSMUSE00000996531 ENSMUST00000072438
12 protein_coding unknown ENSMUSE00000996531 ENSMUST00000005477
13 protein_coding unknown ENSMUSE00000999790 ENSMUST00000072438
14 protein_coding unknown ENSMUSE00000999790 ENSMUST00000005477
15 protein_coding unknown ENSMUSE00000736922 ENSMUST00000144140
16 protein_coding unknown ENSMUSE00000963884 ENSMUST00000072438
17 protein_coding unknown ENSMUSE00000963884 ENSMUST00000005477
18 protein_coding unknown ENSMUSE00001063063 ENSMUST00000072438
19 protein_coding unknown ENSMUSE00001063063 ENSMUST00000005477
20 protein_coding unknown ENSMUSE00000748299 ENSMUST00000144140
21 protein_coding unknown ENSMUSE00000496705 ENSMUST00000005477
22 protein_coding unknown ENSMUSE00000498616 ENSMUST00000072438
23 protein_coding unknown ENSMUSE00000750625 ENSMUST00000005477
24 utr3 unknown ENSMUSE00000750625 ENSMUST00000005477
25 utr3 unknown ENSMUSE00000498616 ENSMUST00000072438
gene symbol density
1 ENSMUSG00000030483 Cyp2b10 1
2 ENSMUSG00000030483 Cyp2b10 1
3 ENSMUSG00000030483 Cyp2b10 1
4 ENSMUSG00000030483 Cyp2b10 1
5 ENSMUSG00000030483 Cyp2b10 1
6 ENSMUSG00000030483 Cyp2b10 1
7 ENSMUSG00000030483 Cyp2b10 1
8 ENSMUSG00000030483 Cyp2b10 1
9 ENSMUSG00000030483 Cyp2b10 1
10 ENSMUSG00000030483 Cyp2b10 1
11 ENSMUSG00000030483 Cyp2b10 1
12 ENSMUSG00000030483 Cyp2b10 1
13 ENSMUSG00000030483 Cyp2b10 1
14 ENSMUSG00000030483 Cyp2b10 1
15 ENSMUSG00000030483 Cyp2b10 1
16 ENSMUSG00000030483 Cyp2b10 1
17 ENSMUSG00000030483 Cyp2b10 1
18 ENSMUSG00000030483 Cyp2b10 1
19 ENSMUSG00000030483 Cyp2b10 1
20 ENSMUSG00000030483 Cyp2b10 1
21 ENSMUSG00000030483 Cyp2b10 1
22 ENSMUSG00000030483 Cyp2b10 1
23 ENSMUSG00000030483 Cyp2b10 1
24 ENSMUSG00000030483 Cyp2b10 1
25 ENSMUSG00000030483 Cyp2b10 1
>
> ## Grouping
> group(grTrack)
[1] "ENSMUST00000072438" "ENSMUST00000005477" "ENSMUST00000072438"
[4] "ENSMUST00000005477" "ENSMUST00000072438" "ENSMUST00000005477"
[7] "ENSMUST00000072438" "ENSMUST00000005477" "ENSMUST00000072438"
[10] "ENSMUST00000005477" "ENSMUST00000072438" "ENSMUST00000005477"
[13] "ENSMUST00000072438" "ENSMUST00000005477" "ENSMUST00000144140"
[16] "ENSMUST00000072438" "ENSMUST00000005477" "ENSMUST00000072438"
[19] "ENSMUST00000005477" "ENSMUST00000144140" "ENSMUST00000005477"
[22] "ENSMUST00000072438" "ENSMUST00000005477" "ENSMUST00000005477"
[25] "ENSMUST00000072438"
> group(subTrack) <- "Group 1"
> transcript(subTrack)
[1] "Group 1" "Group 1"
> plotTracks(subTrack)
>
> ## Collapsing transcripts
> plotTracks(grTrack, collapseTranscripts=TRUE, showId=TRUE,
+ extend.left=10000, shape="arrow")
>
> ## Stacking
> stacking(grTrack)
[1] "squish"
> stacking(grTrack) <- "dense"
> plotTracks(grTrack)
>
> ## coercion
> as(grTrack, "data.frame")
X.seqnames X.start X.end X.width X.strand X.feature X.id
1 chr7 25897620 25897684 65 + utr5 unknown
2 chr7 25897676 25897684 9 + utr5 unknown
3 chr7 25897685 25897855 171 + protein_coding unknown
4 chr7 25897685 25897855 171 + protein_coding unknown
5 chr7 25911238 25911400 163 + protein_coding unknown
6 chr7 25911238 25911400 163 + protein_coding unknown
7 chr7 25911554 25911703 150 + protein_coding unknown
8 chr7 25911554 25911703 150 + protein_coding unknown
9 chr7 25913865 25914025 161 + protein_coding unknown
10 chr7 25913865 25914025 161 + protein_coding unknown
11 chr7 25914748 25914924 177 + protein_coding unknown
12 chr7 25914748 25914924 177 + protein_coding unknown
13 chr7 25915392 25915533 142 + protein_coding unknown
14 chr7 25915392 25915533 142 + protein_coding unknown
15 chr7 25916766 25917121 356 + protein_coding unknown
16 chr7 25916934 25917121 188 + protein_coding unknown
17 chr7 25916934 25917121 188 + protein_coding unknown
18 chr7 25917288 25917429 142 + protein_coding unknown
19 chr7 25917288 25917429 142 + protein_coding unknown
20 chr7 25917288 25917430 143 + protein_coding unknown
21 chr7 25925373 25925399 27 + protein_coding unknown
22 chr7 25926068 25926249 182 + protein_coding unknown
23 chr7 25926068 25926249 182 + protein_coding unknown
24 chr7 25926250 25926559 310 + utr3 unknown
25 chr7 25926250 25926624 375 + utr3 unknown
X.exon X.transcript X.gene X.symbol X.density
1 ENSMUSE00000742021 ENSMUST00000072438 ENSMUSG00000030483 Cyp2b10 1
2 ENSMUSE00000489385 ENSMUST00000005477 ENSMUSG00000030483 Cyp2b10 1
3 ENSMUSE00000742021 ENSMUST00000072438 ENSMUSG00000030483 Cyp2b10 1
4 ENSMUSE00000489385 ENSMUST00000005477 ENSMUSG00000030483 Cyp2b10 1
5 ENSMUSE00000973560 ENSMUST00000072438 ENSMUSG00000030483 Cyp2b10 1
6 ENSMUSE00000973560 ENSMUST00000005477 ENSMUSG00000030483 Cyp2b10 1
7 ENSMUSE00001043622 ENSMUST00000072438 ENSMUSG00000030483 Cyp2b10 1
8 ENSMUSE00001043622 ENSMUST00000005477 ENSMUSG00000030483 Cyp2b10 1
9 ENSMUSE00001013991 ENSMUST00000072438 ENSMUSG00000030483 Cyp2b10 1
10 ENSMUSE00001013991 ENSMUST00000005477 ENSMUSG00000030483 Cyp2b10 1
11 ENSMUSE00000996531 ENSMUST00000072438 ENSMUSG00000030483 Cyp2b10 1
12 ENSMUSE00000996531 ENSMUST00000005477 ENSMUSG00000030483 Cyp2b10 1
13 ENSMUSE00000999790 ENSMUST00000072438 ENSMUSG00000030483 Cyp2b10 1
14 ENSMUSE00000999790 ENSMUST00000005477 ENSMUSG00000030483 Cyp2b10 1
15 ENSMUSE00000736922 ENSMUST00000144140 ENSMUSG00000030483 Cyp2b10 1
16 ENSMUSE00000963884 ENSMUST00000072438 ENSMUSG00000030483 Cyp2b10 1
17 ENSMUSE00000963884 ENSMUST00000005477 ENSMUSG00000030483 Cyp2b10 1
18 ENSMUSE00001063063 ENSMUST00000072438 ENSMUSG00000030483 Cyp2b10 1
19 ENSMUSE00001063063 ENSMUST00000005477 ENSMUSG00000030483 Cyp2b10 1
20 ENSMUSE00000748299 ENSMUST00000144140 ENSMUSG00000030483 Cyp2b10 1
21 ENSMUSE00000496705 ENSMUST00000005477 ENSMUSG00000030483 Cyp2b10 1
22 ENSMUSE00000498616 ENSMUST00000072438 ENSMUSG00000030483 Cyp2b10 1
23 ENSMUSE00000750625 ENSMUST00000005477 ENSMUSG00000030483 Cyp2b10 1
24 ENSMUSE00000750625 ENSMUST00000005477 ENSMUSG00000030483 Cyp2b10 1
25 ENSMUSE00000498616 ENSMUST00000072438 ENSMUSG00000030483 Cyp2b10 1
feature id exon transcript
1 utr5 unknown ENSMUSE00000742021 ENSMUST00000072438
2 utr5 unknown ENSMUSE00000489385 ENSMUST00000005477
3 protein_coding unknown ENSMUSE00000742021 ENSMUST00000072438
4 protein_coding unknown ENSMUSE00000489385 ENSMUST00000005477
5 protein_coding unknown ENSMUSE00000973560 ENSMUST00000072438
6 protein_coding unknown ENSMUSE00000973560 ENSMUST00000005477
7 protein_coding unknown ENSMUSE00001043622 ENSMUST00000072438
8 protein_coding unknown ENSMUSE00001043622 ENSMUST00000005477
9 protein_coding unknown ENSMUSE00001013991 ENSMUST00000072438
10 protein_coding unknown ENSMUSE00001013991 ENSMUST00000005477
11 protein_coding unknown ENSMUSE00000996531 ENSMUST00000072438
12 protein_coding unknown ENSMUSE00000996531 ENSMUST00000005477
13 protein_coding unknown ENSMUSE00000999790 ENSMUST00000072438
14 protein_coding unknown ENSMUSE00000999790 ENSMUST00000005477
15 protein_coding unknown ENSMUSE00000736922 ENSMUST00000144140
16 protein_coding unknown ENSMUSE00000963884 ENSMUST00000072438
17 protein_coding unknown ENSMUSE00000963884 ENSMUST00000005477
18 protein_coding unknown ENSMUSE00001063063 ENSMUST00000072438
19 protein_coding unknown ENSMUSE00001063063 ENSMUST00000005477
20 protein_coding unknown ENSMUSE00000748299 ENSMUST00000144140
21 protein_coding unknown ENSMUSE00000496705 ENSMUST00000005477
22 protein_coding unknown ENSMUSE00000498616 ENSMUST00000072438
23 protein_coding unknown ENSMUSE00000750625 ENSMUST00000005477
24 utr3 unknown ENSMUSE00000750625 ENSMUST00000005477
25 utr3 unknown ENSMUSE00000498616 ENSMUST00000072438
gene symbol density
1 ENSMUSG00000030483 Cyp2b10 1
2 ENSMUSG00000030483 Cyp2b10 1
3 ENSMUSG00000030483 Cyp2b10 1
4 ENSMUSG00000030483 Cyp2b10 1
5 ENSMUSG00000030483 Cyp2b10 1
6 ENSMUSG00000030483 Cyp2b10 1
7 ENSMUSG00000030483 Cyp2b10 1
8 ENSMUSG00000030483 Cyp2b10 1
9 ENSMUSG00000030483 Cyp2b10 1
10 ENSMUSG00000030483 Cyp2b10 1
11 ENSMUSG00000030483 Cyp2b10 1
12 ENSMUSG00000030483 Cyp2b10 1
13 ENSMUSG00000030483 Cyp2b10 1
14 ENSMUSG00000030483 Cyp2b10 1
15 ENSMUSG00000030483 Cyp2b10 1
16 ENSMUSG00000030483 Cyp2b10 1
17 ENSMUSG00000030483 Cyp2b10 1
18 ENSMUSG00000030483 Cyp2b10 1
19 ENSMUSG00000030483 Cyp2b10 1
20 ENSMUSG00000030483 Cyp2b10 1
21 ENSMUSG00000030483 Cyp2b10 1
22 ENSMUSG00000030483 Cyp2b10 1
23 ENSMUSG00000030483 Cyp2b10 1
24 ENSMUSG00000030483 Cyp2b10 1
25 ENSMUSG00000030483 Cyp2b10 1
> as(grTrack, "UCSCData")
UCSC track 'foo'
UCSCData object with 3 ranges and 6 metadata columns:
seqnames ranges strand | id
<Rle> <IRanges> <Rle> | <character>
ENSMUST00000005477 chr7 [25897676, 25926559] + | ENSMUST00000005477
ENSMUST00000072438 chr7 [25897620, 25926624] + | ENSMUST00000072438
ENSMUST00000144140 chr7 [25916766, 25917430] + | ENSMUST00000144140
name itemRgb blockCount
<character> <character> <integer>
ENSMUST00000005477 Cyp2b10 #FFD58A 12
ENSMUST00000072438 Cyp2b10 #FFD58A 11
ENSMUST00000144140 Cyp2b10 #FFD58A 2
blockSizes
<character>
ENSMUST00000005477 9,171,163,150,161,177,142,188,142,27,182,310
ENSMUST00000072438 65,171,163,150,161,177,142,188,142,182,375
ENSMUST00000144140 356,143
blockStarts
<character>
ENSMUST00000005477 0,9,13562,13878,16189,17072,17716,19258,19612,27697,28392,28574
ENSMUST00000072438 0,65,13618,13934,16245,17128,17772,19314,19668,28448,28630
ENSMUST00000144140 0,522
-------
seqinfo: 1 sequence from an unspecified genome; no seqlengths
>
> ## HTML image map
> coords(grTrack)
NULL
> tags(grTrack)
NULL
> grTrack <- plotTracks(grTrack)$foo
> coords(grTrack)
x1 y1 x2 y2
ENSMUSE00000973560 239.54551 64.50 241.93921 415.50
ENSMUSE00001043622 244.21469 64.50 246.41630 415.50
ENSMUSE00001013991 278.36174 64.50 280.72588 415.50
ENSMUSE00000996531 291.40884 64.50 294.00939 415.50
ENSMUSE00000999790 300.92450 64.50 303.00790 415.50
ENSMUSE00000963884 323.70890 64.50 326.47199 415.50
ENSMUSE00001063063 328.93956 64.50 331.02296 415.50
ENSMUSE00000498616 458.67175 64.50 461.34619 415.50
ENSMUSE00000498616.1 461.36096 152.25 466.88714 327.75
ENSMUSE00000973560.1 239.54551 64.50 241.93921 415.50
ENSMUSE00001043622.1 244.21469 64.50 246.41630 415.50
ENSMUSE00001013991.1 278.36174 64.50 280.72588 415.50
ENSMUSE00000996531.1 291.40884 64.50 294.00939 415.50
ENSMUSE00000999790.1 300.92450 64.50 303.00790 415.50
ENSMUSE00000963884.1 323.70890 64.50 326.47199 415.50
ENSMUSE00001063063.1 328.93956 64.50 331.02296 415.50
ENSMUSE00000496705 448.09222 64.50 449.08221 415.50
ENSMUSE00000750625 458.67175 64.50 461.34619 415.50
ENSMUSE00000750625.1 461.36096 152.25 465.92671 327.75
ENSMUSE00000736922 321.22656 64.50 326.47199 415.50
ENSMUSE00000748299 328.93956 64.50 331.03774 415.50
ENSMUSE00000742021 38.29809 64.50 41.79997 415.50
ENSMUSE00000489385 38.71181 64.50 41.79997 415.50
> tags(grTrack)
$fill
ENSMUSE00000973560 ENSMUSE00001043622 ENSMUSE00001013991
"#FFD58A" "#FFD58A" "#FFD58A"
ENSMUSE00000996531 ENSMUSE00000999790 ENSMUSE00000963884
"#FFD58A" "#FFD58A" "#FFD58A"
ENSMUSE00001063063 ENSMUSE00000498616 ENSMUSE00000498616.1
"#FFD58A" "#FFD58A" "#FFD58A"
ENSMUSE00000973560.1 ENSMUSE00001043622.1 ENSMUSE00001013991.1
"#FFD58A" "#FFD58A" "#FFD58A"
ENSMUSE00000996531.1 ENSMUSE00000999790.1 ENSMUSE00000963884.1
"#FFD58A" "#FFD58A" "#FFD58A"
ENSMUSE00001063063.1 ENSMUSE00000496705 ENSMUSE00000750625
"#FFD58A" "#FFD58A" "#FFD58A"
ENSMUSE00000750625.1 ENSMUSE00000736922 ENSMUSE00000748299
"#FFD58A" "#FFD58A" "#FFD58A"
ENSMUSE00000742021 ENSMUSE00000489385
"#FFD58A" "#FFD58A"
$strand
ENSMUSE00000973560 ENSMUSE00001043622 ENSMUSE00001013991
"+" "+" "+"
ENSMUSE00000996531 ENSMUSE00000999790 ENSMUSE00000963884
"+" "+" "+"
ENSMUSE00001063063 ENSMUSE00000498616 ENSMUSE00000498616.1
"+" "+" "+"
ENSMUSE00000973560.1 ENSMUSE00001043622.1 ENSMUSE00001013991.1
"+" "+" "+"
ENSMUSE00000996531.1 ENSMUSE00000999790.1 ENSMUSE00000963884.1
"+" "+" "+"
ENSMUSE00001063063.1 ENSMUSE00000496705 ENSMUSE00000750625
"+" "+" "+"
ENSMUSE00000750625.1 ENSMUSE00000736922 ENSMUSE00000748299
"+" "+" "+"
ENSMUSE00000742021 ENSMUSE00000489385
"+" "+"
$text
ENSMUSE00000973560 ENSMUSE00001043622 ENSMUSE00001013991
"ENSMUSE00000973560" "ENSMUSE00001043622" "ENSMUSE00001013991"
ENSMUSE00000996531 ENSMUSE00000999790 ENSMUSE00000963884
"ENSMUSE00000996531" "ENSMUSE00000999790" "ENSMUSE00000963884"
ENSMUSE00001063063 ENSMUSE00000498616 ENSMUSE00000498616.1
"ENSMUSE00001063063" "ENSMUSE00000498616" "ENSMUSE00000498616"
ENSMUSE00000973560.1 ENSMUSE00001043622.1 ENSMUSE00001013991.1
"ENSMUSE00000973560" "ENSMUSE00001043622" "ENSMUSE00001013991"
ENSMUSE00000996531.1 ENSMUSE00000999790.1 ENSMUSE00000963884.1
"ENSMUSE00000996531" "ENSMUSE00000999790" "ENSMUSE00000963884"
ENSMUSE00001063063.1 ENSMUSE00000496705 ENSMUSE00000750625
"ENSMUSE00001063063" "ENSMUSE00000496705" "ENSMUSE00000750625"
ENSMUSE00000750625.1 ENSMUSE00000736922 ENSMUSE00000748299
"ENSMUSE00000750625" "ENSMUSE00000736922" "ENSMUSE00000748299"
ENSMUSE00000742021 ENSMUSE00000489385
"ENSMUSE00000742021" "ENSMUSE00000489385"
$start
ENSMUSE00000973560 ENSMUSE00001043622 ENSMUSE00001013991
"25911238" "25911554" "25913865"
ENSMUSE00000996531 ENSMUSE00000999790 ENSMUSE00000963884
"25914748" "25915392" "25916934"
ENSMUSE00001063063 ENSMUSE00000498616 ENSMUSE00000498616.1
"25917288" "25926068" "25926250"
ENSMUSE00000973560.1 ENSMUSE00001043622.1 ENSMUSE00001013991.1
"25911238" "25911554" "25913865"
ENSMUSE00000996531
|