Optional GRanges or
IRanges object to highlight certain regions on
the axis.
name
Character scalar of the track's name used in the title
panel when plotting.
id
A character vector of the same length as range
containing identifiers for the ranges. If missing, the constructor
will try to extract the ids from names(range).
...
Additional items which will all be interpreted as further
display parameters. See settings and the "Display
Parameters" section below for details.
Details
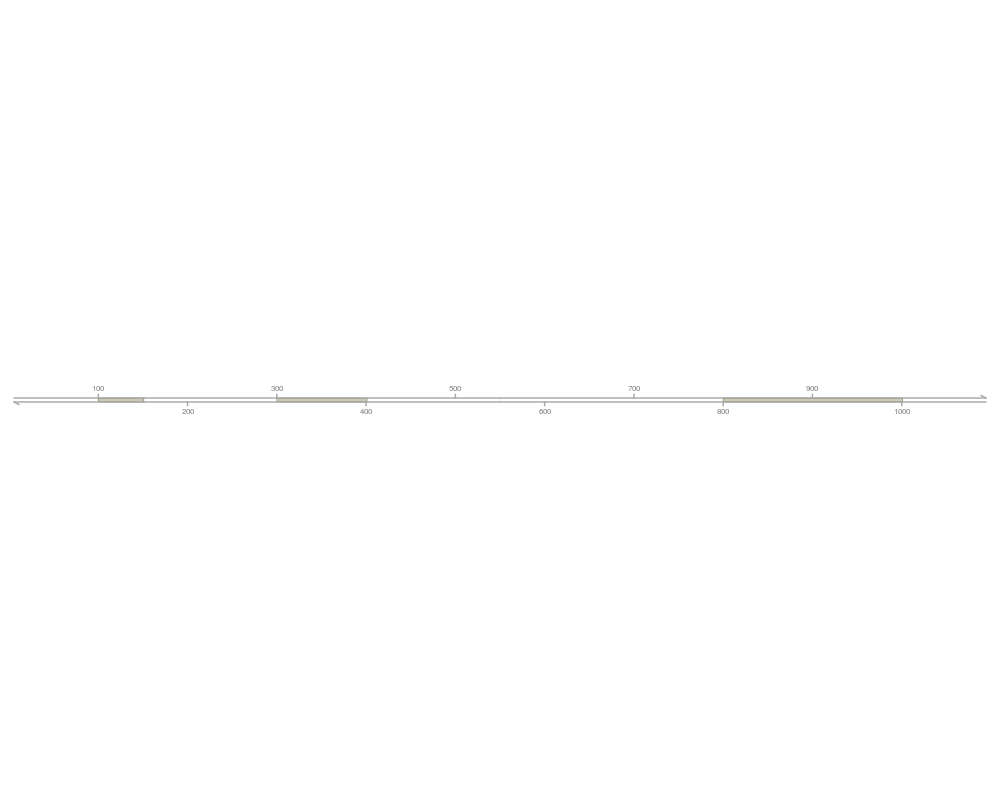
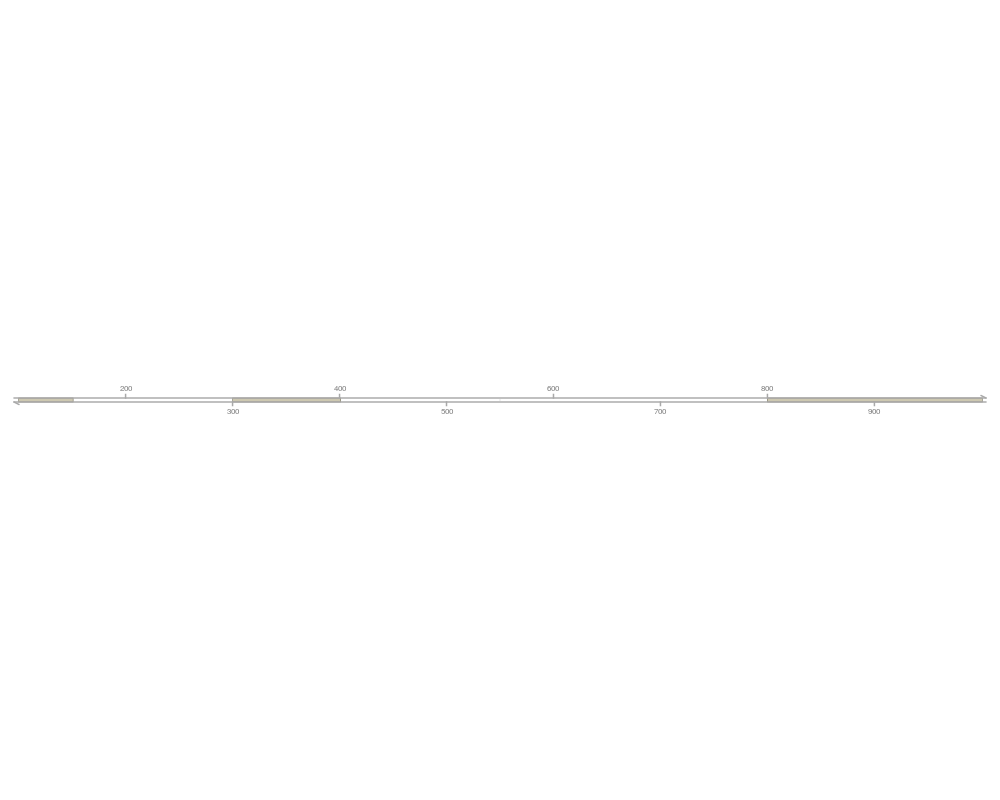
A GenomeAxisTrack can be customized using the familiar display
parameters. By providing a GRanges or IRanges object to
the constructor, ranges on the axis can be further highlighted.
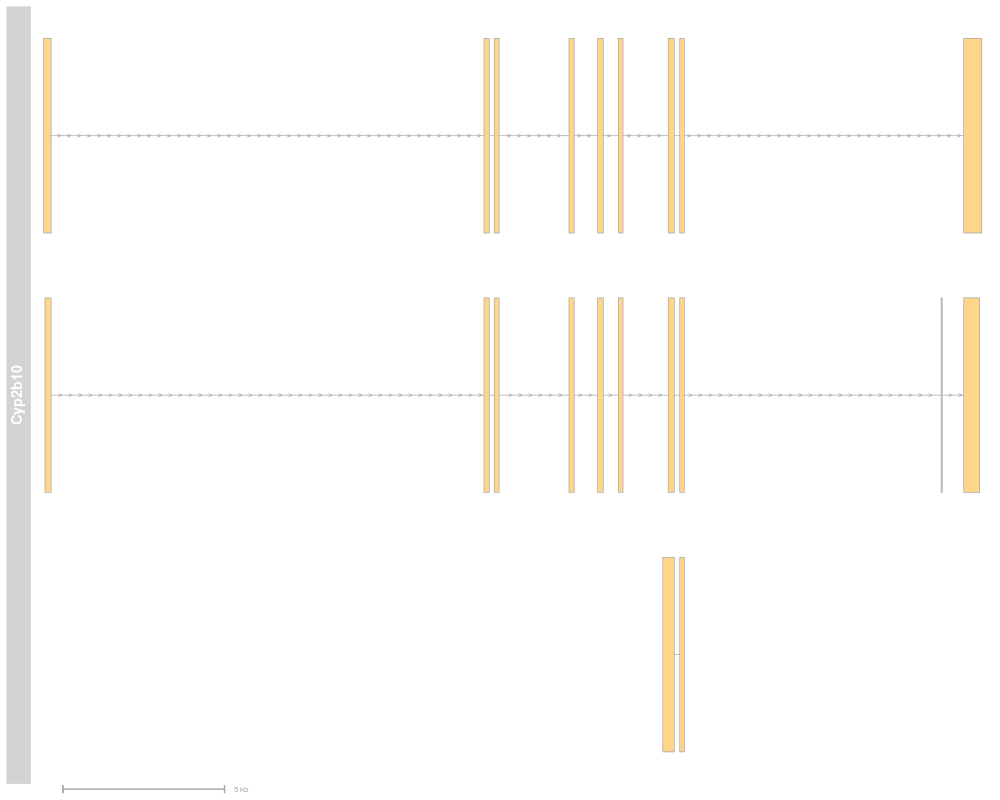
With the scale display parameter, a small scale indicator can
be shown instead of the entire genomic axis. The scale can either be
provided as a fraction of the plotting region (it will be rounded to
the nearest human readable absolute value) or as an absolute value and
is always displayed in bp, kb, mb or gb units. Note that most display
parameters for the GenomeAxisTrack are ignored when a scale is
used insterad of the full axis. In particular, only the parameters
exponent, alpha, lwd, col, cex,
distFromAxis and labelPos are used.
Value
The return value of the constructor function is a new object of class
GenomeAxisTrack.
Objects from the class
Objects can be created using the constructor function
GenomeAxisTrack.
Slots
range:
Object of class GRanges,
highlighted on the axis.
dp:
Object of class
DisplayPars, inherited from class
GdObject
name:
Object of class "character", inherited
from class GdObject
imageMap:
Object of class
ImageMap, inherited from class
GdObject
Extends
Class "GdObject", directly.
Methods
In the following code chunks, obj is considered to be an object of class GenomeAxisTrack.
Exported in the name space:
[
signature(x="GenomeAxisTrack"): subset the
GRanges object in the range slot. For most
applications, the subset method may be more appropriate.
Additional Arguments:
i: subsetting incides.
Examples:
obj[1:5]
start, end, width
signature(x="GenomeAxisTrack"): the
start or end coordinates of the track items, or their width in
genomic coordinates.
Usage:
start(x)
end(x)
width(x)
Examples:
start(obj)
end(obj)
width(obj)
range
signature(x="GenomeAxisTrack"): return the genomic
coordinates for the track as an object of class
IRanges.
Usage:
range(x)
Examples:
range(obj)
ranges
signature(x="GenomeAxisTrack"): return the genomic
coordinates for the track along with all additional annotation
information as an object of class GRanges.
Usage:
ranges(x)
Examples:
ranges(obj)
strand
signature(x="GenomeAxisTrack"): return a vector of
strand specifiers for all track items, in the form '+' for the
Watson strand, '-' for the Crick strand or '*' for either of the
two.
Usage:
strand(x)
Examples:
strand(obj)
values
signature(x="GenomeAxisTrack"): return all
additional annotation information except for the genomic coordinates
for the track items.
Usage:
values(x)
Examples:
values(obj)
subset
signature(x="GenomeAxisTrack"): subset a
GenomeAxisTrack by coordinates and sort if necessary.
Usage:
subset(x, from, to, sort=FALSE, ...)
Additional Arguments:
from, to: the coordinates range to subset
to.
sort: sort the object after subsetting. Usually
not necessary.
...: additional arguments are ignored.
Examples:
subset(obj, from=10, to=20, sort=TRUE)
length
signature(x="GenomeAxisTrack"): return the
number of items stored in the ranges slot.
Usage:
length(x)
Examples:
length(obj)
Internal methods:
drawGD
signature(GdObject="GenomeAxisTrack"): the
workhorse function to plot the object.
prepare: run method in preparation or in
production mode.
subset: subset the object to the visible region
or skip the potentially expensive subsetting operation.
...: all further arguments are ignored.
Examples:
Gviz:::drawGD(obj)
Gviz:::drawGD(obj, minBase=1, maxBase=100)
Gviz:::drawGD(obj, prepare=TRUE,
	    subset=FALSE)
collapseTrack
signature(GdObject="GenomeAxisTrack"):
preprocess the track before plotting. This will collapse
overlapping track items based on the available resolution and
increase the width and height of all track objects to a minimum
value to avoid rendering issues. See collapsing for
details.
diff: the minimum pixel width to display,
everything below that will be inflated to a width of
diff.
Examples:
Gviz:::collapseTrack(obj)
initialize
signature(.Object="GenomeAxisTrack"):
initialize the object
show
signature(object="GenomeAxisTrack"): show a
human-readable summary of the object
Inherited:
displayPars
signature(x="GenomeAxisTrack", name="character"):
list the value of the display parameter name. See
settings for details on display parameters and
customization.
Usage:
displayPars(x, name)
Examples:
displayPars(obj, "col")
displayPars
signature(x="GenomeAxisTrack", name="missing"):
list the value of all available display parameters. See
settings for details on display parameters and
customization.
Examples:
displayPars(obj)
getPar
signature(x="GenomeAxisTrack", name="character"):
alias for the displayPars method. See
settings for details on display parameters and
customization.
Usage:
getPar(x, name)
Examples:
getPar(obj, "col")
getPar
signature(x="GenomeAxisTrack", name="missing"): alias
for the displayPars method. See settings for
details on display parameters and customization.
Examples:
getPar(obj)
displayPars<-
signature(x="GenomeAxisTrack", value="list"):
set display parameters using the values of the named list in
value. See settings for details on display
parameters and customization.
Usage:
displayPars<-(x, value)
Examples:
displayPars(obj) <- list(col="red", lwd=2)
setPar
signature(x="GenomeAxisTrack", value="character"): set
the single display parameter name to value. Note
that display parameters in the GenomeAxisTrack class are
pass-by-reference, so no re-assignmnet to the symbol obj is
necessary. See settings for details on display
parameters and customization.
Usage:
setPar(x, name, value)
Additional Arguments:
name: the name of the display parameter to set.
Examples:
setPar(obj, "col", "red")
setPar
signature(x="GenomeAxisTrack", value="list"): set
display parameters by the values of the named list in
value. Note that display parameters in the GenomeAxisTrack
class are pass-by-reference, so no re-assignmnet to the symbol
obj is necessary. See settings for details on
display parameters and customization.
Examples:
setPar(obj, list(col="red", lwd=2))
group
signature(GdObject="GenomeAxisTrack"): return
grouping information for the individual items in the track. Unless
overwritten in one of the sub-classes, this usualy returns
NULL.
Usage:
group(GdObject)
Examples:
group(obj)
names
signature(x="GenomeAxisTrack"): return the value of
the name slot.
Usage:
names(x)
Examples:
names(obj)
names<-
signature(x="GenomeAxisTrack", value="character"):
set the value of the name slot.
Usage:
names<-(x, value)
Examples:
names(obj) <- "foo"
coords
signature(ImageMap="GenomeAxisTrack"): return the
coordinates from the internal image map.
Usage:
coords(ImageMap)
Examples:
coords(obj)
tags
signature(x="GenomeAxisTrack"): return the tags from the
internal image map.
Usage:
tags(x)
Examples:
tags(obj)
drawAxis
signature(GdObject="GenomeAxisTrack"): add a
y-axis to the title panel of a track if necessary. Unless
overwritten in one of the sub-classes this usualy does not plot
anything and returns NULL.
Usage:
drawAxis(x, ...)
Additional Arguments:
...: all further arguments are ignored.
Examples:
Gviz:::drawAxis(obj)
drawGrid
signature(GdObject="GenomeAxisTrack"): superpose a
grid on top of a track if necessary. Unless overwritten in one of
the sub-classes this usualy does not plot anything and returns
NULL.
Usage:
drawGrid(GdObject, ...)
Additional Arguments:
...: additional arguments are ignored.
Examples:
Gviz:::drawGrid(obj)
Display Parameters
The following display parameters are set for objects of class
GenomeAxisTrack upon instantiation, unless one or more of them
have already been set by one of the optional sub-class initializers,
which always get precedence over these global defaults. See
settings for details on setting graphical parameters
for tracks.
add35=FALSE: Logical scalar. Add 3' to 5' direction
indicators.
add53=FALSE: Logical scalar. Add 5' to 3' direction
indicators.
background.title="transparent": Character scalar.
The background color for the title panel. Defaults to omit the
background.
col.border.title="transparent": Integer or character
scalar. The border color for the title panels.
lwd.border.title=1: Integer scalar. The border
width for the title panels.
cex=0.8: Numeric scalar. The overall font expansion
factor for the axis annotation text.
cex.id=0.7: Numeric scalar. The text size for the
optional range annotation.
col="darkgray": Character scalar. The color for the
axis lines and tickmarks.
col.id="white": Character scalar. The text color
for the optional range annotation.
col.range="cornsilk4": Character scalar. The border
color for highlighted regions on the axis.
distFromAxis=1: Numeric scalar. Control the distance
of the axis annotation from the tick marks.
exponent=NULL: Numeric scalar. The exponent for the
axis coordinates, e.g., 3 means mb, 6 means gb, etc. The default
is to automatically determine the optimal exponent.
fill.range="cornsilk3": Character scalar. The fill
color for highlighted regions on the axis.
fontcolor="#808080": Character scalar. The font
color for the axis annotation text.
fontsize=10: Numeric scalar. Font size for the axis
annotation text in points.
labelPos="alternating": Character vector, one in
"alternating", "revAlternating", "above" or "below". The vertical
positioning of the axis labels. If scale is not NULL,
the possible values are "above", "below" and "beside".
littleTicks=FALSE: Logical scalar. Add more fine-grained
tick marks.
lwd=2: Numeric scalar. The line width for the axis
elementes.
showId=FALSE: Logical scalar. Show the optional
range highlighting annotation.
showTitle=FALSE: Logical scalar. Plot a title panel.
Defaults to omit the title panel.
size=NULL: Numeric scalar. The relative size of the
track. Can be overridden in the plotTracks function.
Defaults to the ideal size based on the other track settings.
scale=NULL: Numeric scalar. If not NULL a
small scale is drawn instead of the full axis, if the value is
between 0 and 1 it is interpreted as a fraction of the current
plotting region, otherwise as an absolute length value in genomic
coordinates.
Additional display parameters are being inherited from the respective
parent classes. Note that not all of them may have an effect on the
plotting of GenomeAxisTrack objects.
GdObject:
alpha=1: Numeric scalar. The transparency for
all track items.
background.panel="transparent": Integer or
character scalar. The background color of the content panel.
cex.axis=NULL: Numeric scalar. The expansion
factor for the axis annotation. Defaults to NULL, in
which case it is computed based on the available space.
cex.title=NULL: Numeric scalar. The expansion
factor for the title panel. This effects the fontsize of both
the title and the axis, if any. Defaults to NULL,
which means that the text size is automatically adjusted to
the available space.
col.axis="white": Integer or character scalar.
The font and line color for the y axis, if any.
col.frame="lightgray": Integer or character
scalar. The line color used for the panel frame, if
frame==TRUE
col.grid="#808080": Integer or character scalar.
Default line color for grid lines, both when type=="g"
in DataTracks and when display parameter
grid==TRUE.
col.line=NULL: Integer or character scalar.
Default colors for plot lines. Usually the same as the global
col parameter.
col.symbol=NULL: Integer or character scalar.
Default colors for plot symbols. Usually the same as the
global col parameter.
col.title="white": Integer or character scalar.
The font color for the title panels.
collapse=TRUE: Boolean controlling wether to
collapse the content of the track to accomodate the minimum
current device resolution. See collapsing for
details.
fill="lightgray": Integer or character scalar.
Default fill color setting for all plotting elements, unless
there is a more specific control defined elsewhere.
fontface=1: Integer or character scalar. The
font face for all text.
fontface.title=2: Integer or character scalar.
The font face for the title panels.
fontfamily="sans": Integer or character scalar.
The font family for all text.
fontfamily.title="sans": Integer or character
scalar. The font family for the title panels.
frame=FALSE: Boolean. Draw a frame around the
track when plotting.
grid=FALSE: Boolean, switching on/off the plotting
of a grid.
h=-1: Integer scalar. Parameter controlling the
number of horizontal grid lines, see panel.grid
for details.
lineheight=1: Numeric scalar. The font line
height for all text.
lty="solid": Numeric scalar. Default line type
setting for all plotting elements, unless there is a more
specific control defined elsewhere.
lty.grid="solid": Integer or character scalar.
Default line type for grid lines, both when type=="g"
in DataTracks and when display parameter
grid==TRUE.
lwd.grid=1: Numeric scalar. Default line width
for grid lines, both when type=="g" in DataTracks
and when display parameter grid==TRUE.
min.distance=1: Numeric scalar. The minimum
pixel distance before collapsing range items, only if
collapse==TRUE. See collapsing for details.
min.height=3: Numeric scalar. The minimum range
height in pixels to display. All ranges are expanded to this
size in order to avoid rendering issues. See collapsing
for details.
min.width=1: Numeric scalar. The minimum range
width in pixels to display. All ranges are expanded to this
size in order to avoid rendering issues. See collapsing
for details.
showAxis=TRUE: Boolean controlling whether to
plot a y axis (only applies to track types where axes are
implemented).
v=-1: Integer scalar. Parameter controlling the
number of vertical grid lines, see panel.grid
for details.
 .
.