The function plots the structure of Hierarchical Archimedean Copulae.
Usage
## S3 method for class 'hac'
plot(x, xlim = NULL, ylim = NULL, xlab = "", ylab = "",
col = "black", fg = "black", bg = "white", col.t = "black", lwd = 2,
index = FALSE, numbering = FALSE, theta = TRUE, h = 0.4, l = 1.2,
circles = 0.25, digits = 2, ...)
Arguments
x
a hac object. It can be constructed by hac or be the result of estimate.copula.
xlim, ylim
numeric vectors of length 2, giving the limits of the x and y axes. The default values adjust the size of the coordinate plane automatically with respect to the dimension of the HAC.
xlab, ylab
titles for the x and y axes.
col
defines the color of the lines, which connect the circles and rectangles.
fg
defines the color of the lines of the rectangles and circles equivalent to the color settings in R.
bg
defines the background color of the rectangles and circles equivalent to the color settings in R.
col.t
defines the text color equivalent to the color settings in R.
lwd
the width of the lines.
index
boolean. If index = TRUE, strings, which illustrate the subcopulae of the nodes, are used as subsrcipts of the dependency parameters.
numbering
boolean. If index = TRUE and numbering = TRUE, the dependency parameters are numbered. If x is returned by estimate.copula, the numbers correpsond to the estimation stages.
theta
boolean. Determines, whether the dependency parameter θ or Kendall's rank correlation coefficient τ is printed.
h
the height of the rectangles.
l
the width of the rectangles.
circles
a positive number giving the radius of the circles.
digits
an integer specifying the number of digits of the dependence parameter.
...
arguments to be passed to methods, e.g. graphical parameters (see par).
References
Okhrin, O. and Ristig, A. 2014, Hierarchical Archimedean Copulae: The HAC Package", Journal of Statistical Software, 58(4), 1-20, http://www.jstatsoft.org/v58/i04/.
See Also
estimate.copula
Examples
# a hac object is created
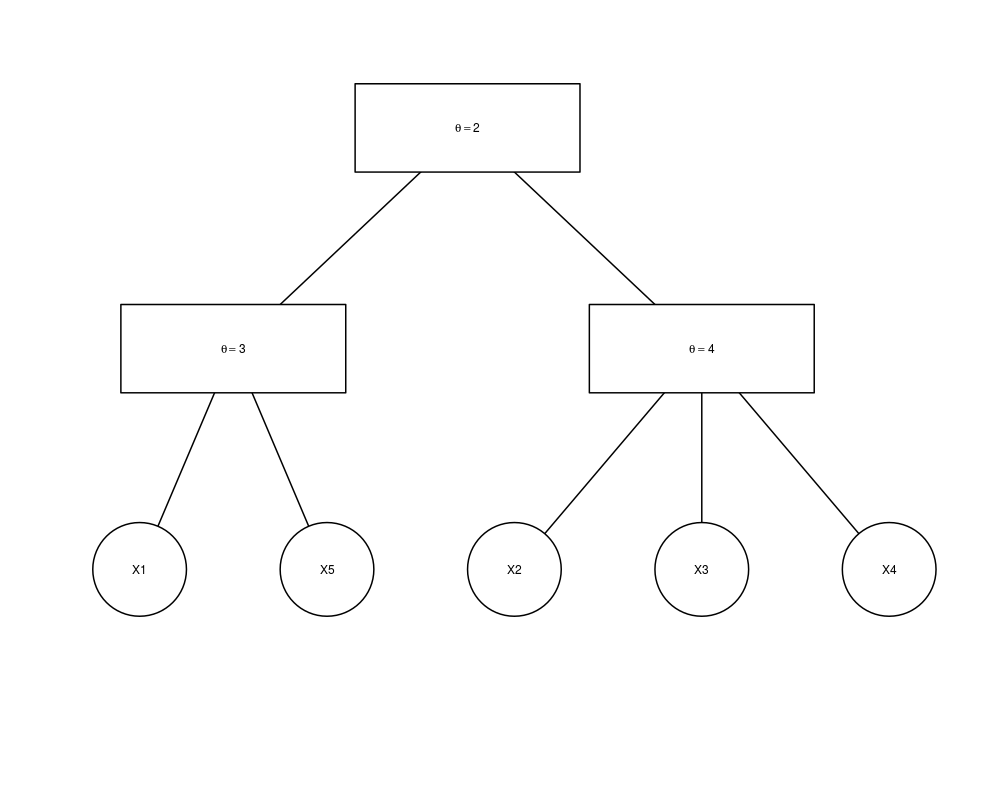
tree = list(list("X1", "X5", 3), list("X2", "X3", "X4", 4), 2)
model = hac(type = 1, tree = tree)
plot(model)
# the same procedure works for an estimated object
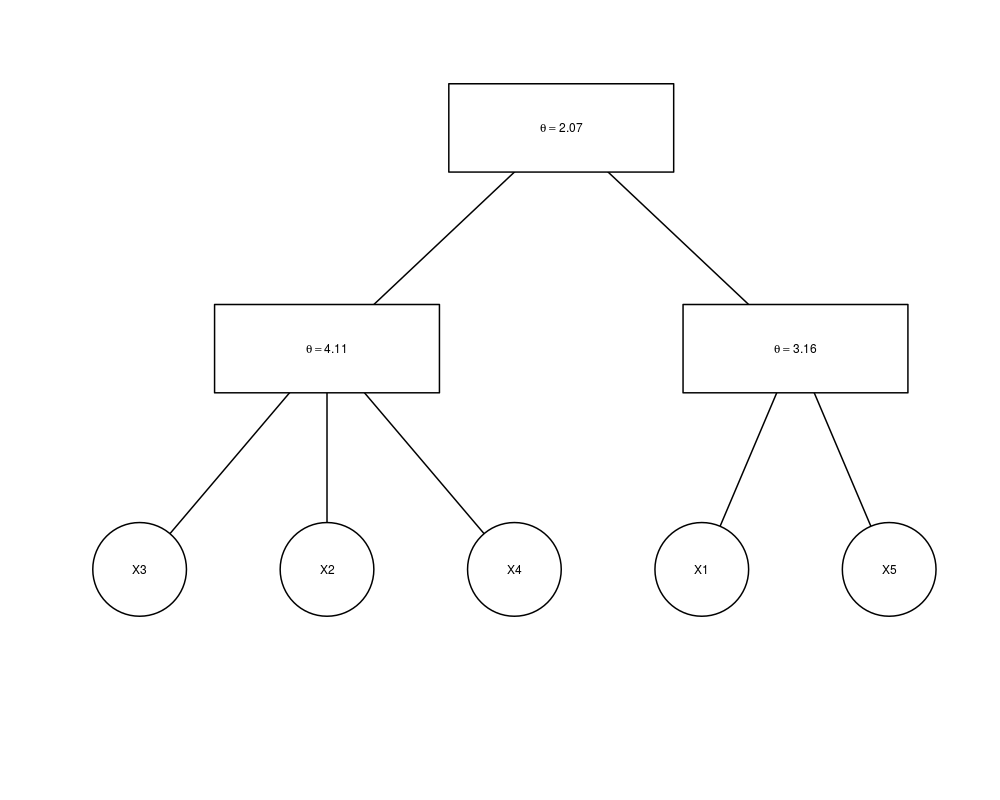
sample = rHAC(2000, model)
est.obj = estimate.copula(sample, epsilon = 0.2)
plot(est.obj)
Results
R version 3.3.1 (2016-06-21) -- "Bug in Your Hair"
Copyright (C) 2016 The R Foundation for Statistical Computing
Platform: x86_64-pc-linux-gnu (64-bit)

R is free software and comes with ABSOLUTELY NO WARRANTY.
You are welcome to redistribute it under certain conditions.
Type 'license()' or 'licence()' for distribution details.

R is a collaborative project with many contributors.
Type 'contributors()' for more information and
'citation()' on how to cite R or R packages in publications.

Type 'demo()' for some demos, 'help()' for on-line help, or
'help.start()' for an HTML browser interface to help.
Type 'q()' to quit R.

> library(HAC)
Loading required package: copula
> png(filename="/home/ddbj/snapshot/RGM3/R_CC/result/HAC/plot.hac.Rd_%03d_medium.png", width=480, height=480)
> ### Name: plot.hac
> ### Title: Plot of a HAC
> ### Aliases: plot.hac
>
> ### ** Examples
>
> # a hac object is created
>
> tree = list(list("X1", "X5", 3), list("X2", "X3", "X4", 4), 2)
> model = hac(type = 1, tree = tree)
> plot(model)
>
> # the same procedure works for an estimated object
>
> sample = rHAC(2000, model)
[1] "X1 <-> 1"
[1] "X5 <-> 2"
[1] "X2 <-> 3"
[1] "X3 <-> 4"
[1] "X4 <-> 5"
Warning message:
In hac2nacopula(hac) : NAs introduced by coercion
> est.obj = estimate.copula(sample, epsilon = 0.2)
> plot(est.obj)
>
>
>
>
>
> dev.off()
null device
          1
>
 .
.