The step at which you want to plot the coefficients.
ylab
Name of the y axis.
xlab
Name of the x axis.
...
Other plot arguments.
See Also
HDlarsLarsPath
Examples
dataset=simul(50,1000,0.4,10,50,matrix(c(0.1,0.8,0.02,0.02),nrow=2))
result=HDfusion(dataset$data,dataset$response)
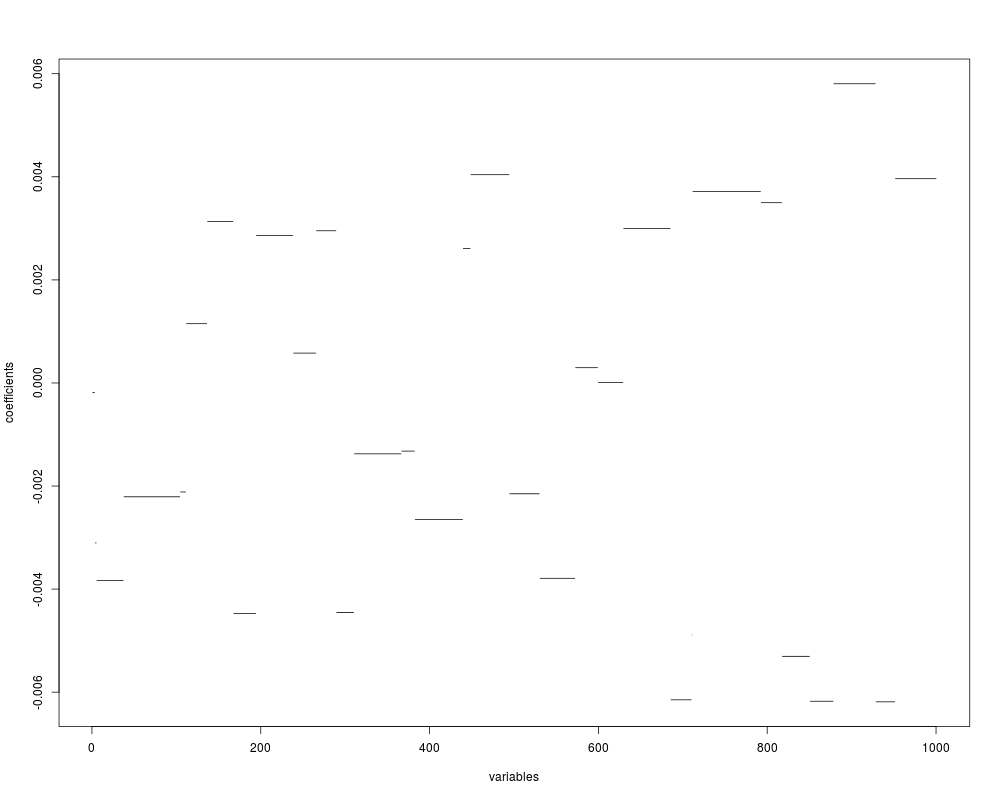
plotCoefficient(result,result@nbStep) #plot coefficients at the last step
Results
R version 3.3.1 (2016-06-21) -- "Bug in Your Hair"
Copyright (C) 2016 The R Foundation for Statistical Computing
Platform: x86_64-pc-linux-gnu (64-bit)

R is free software and comes with ABSOLUTELY NO WARRANTY.
You are welcome to redistribute it under certain conditions.
Type 'license()' or 'licence()' for distribution details.

R is a collaborative project with many contributors.
Type 'contributors()' for more information and
'citation()' on how to cite R or R packages in publications.

Type 'demo()' for some demos, 'help()' for on-line help, or
'help.start()' for an HTML browser interface to help.
Type 'q()' to quit R.

> library(HDPenReg)
Loading required package: rtkore
Loading required package: Rcpp

Attaching package: 'rtkore'

The following object is masked from 'package:Rcpp':

    LdFlags

> png(filename="/home/ddbj/snapshot/RGM3/R_CC/result/HDPenReg/plotCoefficient.Rd_%03d_medium.png", width=480, height=480)
> ### Name: plotCoefficient
> ### Title: Plot of coefficients
> ### Aliases: plotCoefficient
>
> ### ** Examples
>
> dataset=simul(50,1000,0.4,10,50,matrix(c(0.1,0.8,0.02,0.02),nrow=2))
> result=HDfusion(dataset$data,dataset$response)
> plotCoefficient(result,result@nbStep) #plot coefficients at the last step
>
>
>
>
>
> dev.off()
null device
          1
>
 .
.