Supported by Dr. Osamu Ogasawara and  . . |
|
Last data update: 2014.03.03 |
Plot solution paths from a "HDtweedie" objectDescriptionProduces a coefficient profile plot of the coefficient paths for a
fitted Usage## S3 method for class 'HDtweedie' plot(x, group = FALSE, log.l = TRUE, ...) Arguments
DetailsA coefficient profile plot is produced. Author(s)Wei Qian, Yi Yang and Hui Zou ReferencesQian, W., Yang, Y., Yang, Y. and Zou, H. (2013), “Tweedie's Compound
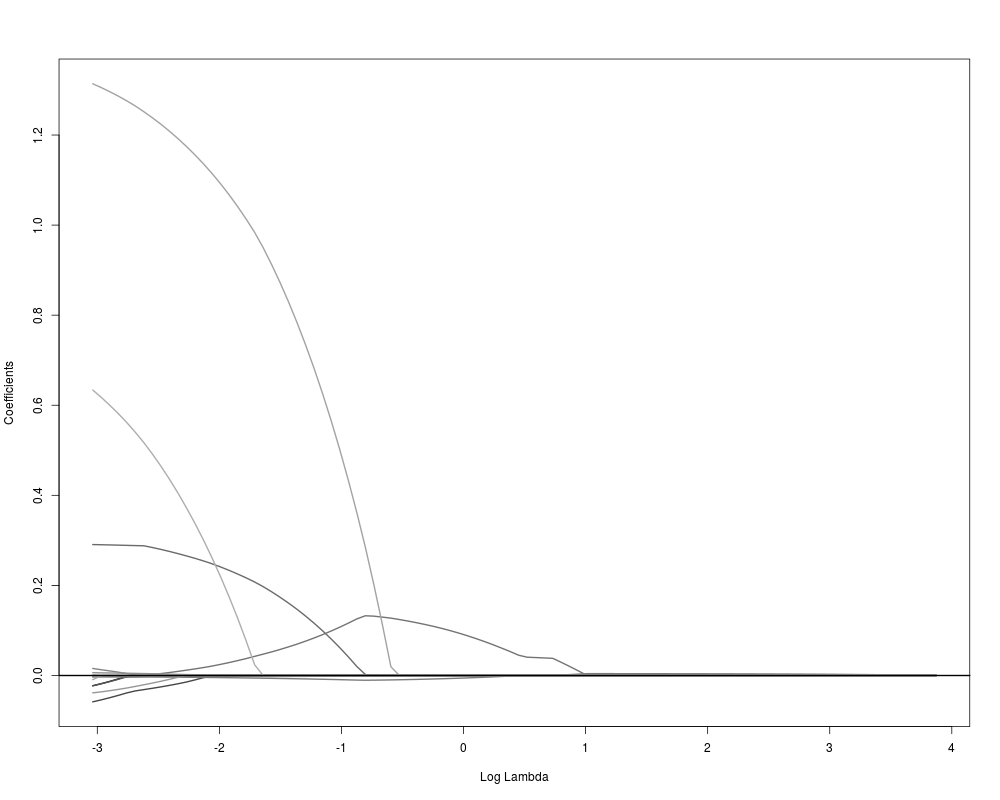
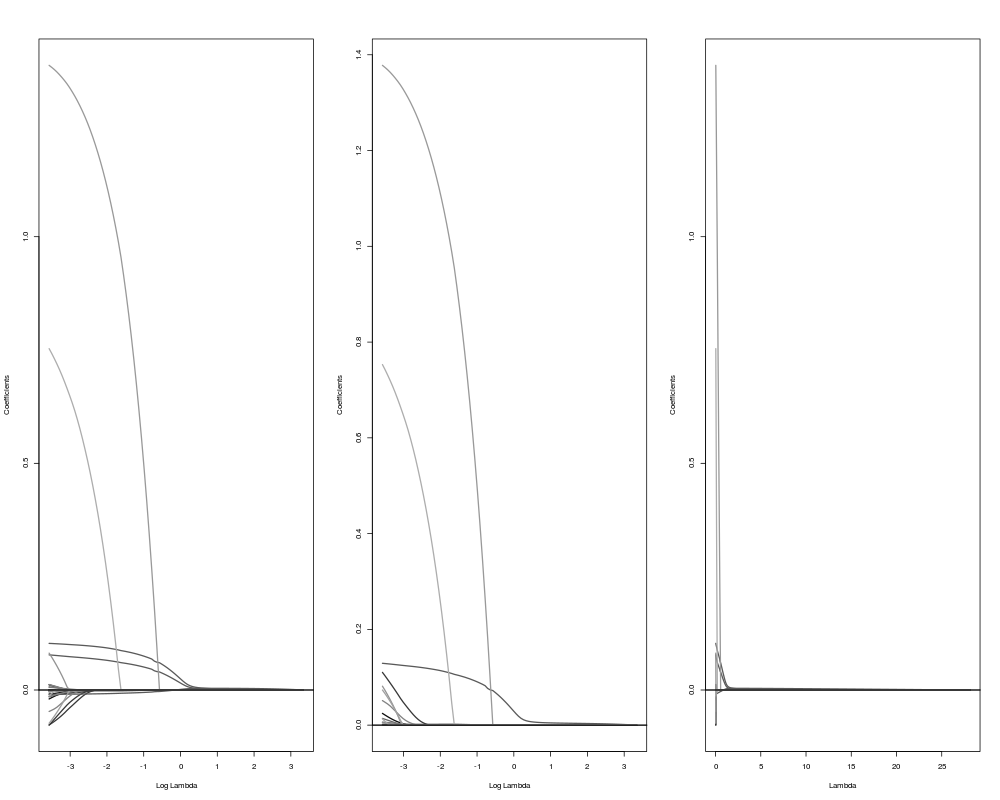
Poisson Model With Grouped Elastic Net,” submitted to Journal of Computational and Graphical Statistics. Examples# load HDtweedie library library(HDtweedie) # load data set data(auto) # fit the lasso m0 <- HDtweedie(x=auto$x,y=auto$y,p=1.5) # make plot plot(m0) # plots the coefficients against the log-lambda sequence # define group index group1 <- c(rep(1,5),rep(2,7),rep(3,4),rep(4:14,each=3),15:21) # fit group lasso m1 <- HDtweedie(x=auto$x,y=auto$y,group=group1,p=1.5) # make plots par(mfrow=c(1,3)) plot(m1) # plots the coefficients against the log-lambda sequence plot(m1,group=TRUE) # plots group norm against the log-lambda sequence plot(m1,log.l=FALSE) # plots against the lambda sequence Results
R version 3.3.1 (2016-06-21) -- "Bug in Your Hair"
Copyright (C) 2016 The R Foundation for Statistical Computing
Platform: x86_64-pc-linux-gnu (64-bit)

R is free software and comes with ABSOLUTELY NO WARRANTY.
You are welcome to redistribute it under certain conditions.
Type 'license()' or 'licence()' for distribution details.

R is a collaborative project with many contributors.
Type 'contributors()' for more information and
'citation()' on how to cite R or R packages in publications.

Type 'demo()' for some demos, 'help()' for on-line help, or
'help.start()' for an HTML browser interface to help.
Type 'q()' to quit R.

> library(HDtweedie)
> png(filename="/home/ddbj/snapshot/RGM3/R_CC/result/HDtweedie/plot.HDtweedie.Rd_%03d_medium.png", width=480, height=480)
> ### Name: plot.HDtweedie
> ### Title: Plot solution paths from a "HDtweedie" object
> ### Aliases: plot.HDtweedie
> ### Keywords: models regression
>
> ### ** Examples
>
> # load HDtweedie library
> library(HDtweedie)
>
> # load data set
> data(auto)
>
> # fit the lasso
> m0 <- HDtweedie(x=auto$x,y=auto$y,p=1.5)
>
> # make plot
> plot(m0) # plots the coefficients against the log-lambda sequence
>
> # define group index
> group1 <- c(rep(1,5),rep(2,7),rep(3,4),rep(4:14,each=3),15:21)
>
> # fit group lasso
> m1 <- HDtweedie(x=auto$x,y=auto$y,group=group1,p=1.5)
>
> # make plots
> par(mfrow=c(1,3))
> plot(m1) # plots the coefficients against the log-lambda sequence
> plot(m1,group=TRUE) # plots group norm against the log-lambda sequence
> plot(m1,log.l=FALSE) # plots against the lambda sequence
>
>
>
>
>
> dev.off()
null device
          1
>
|
Created & Maintained by Osamu Ogasawara (osamu.ogasawara@gmail.com) and 