Supported by Dr. Osamu Ogasawara and  . . |
|
Last data update: 2014.03.03 |
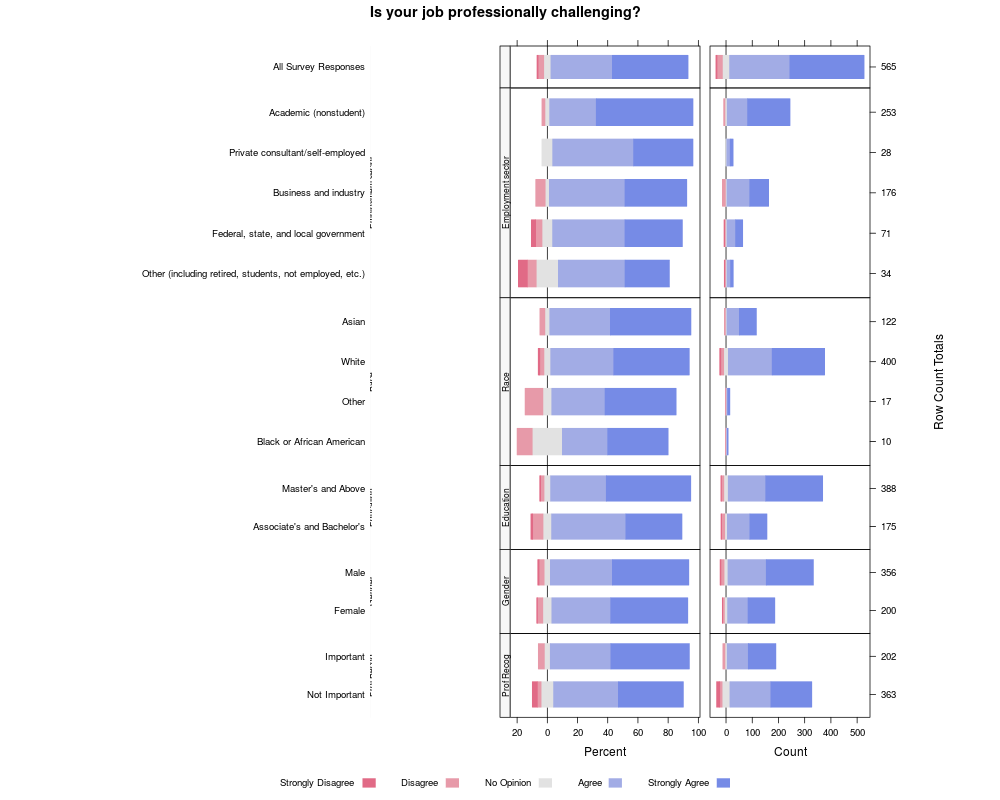
Display likert plots with percents in the first column of panels and counts in the second column of panels.DescriptionDisplay likert plots with percents in the first column of panels and counts in the second column of panels. Order the rows either in their original order or by the positive order of the percent display. Usage
LikertPercentCountColumns(
           x, data,
           px=list( ## defaults designed for long QuestionName values
             LL=c(.00,  .50), ## and 7in x 7in window
             LP=c(.50,  .70),
             ML=c(.50,  .51),  ## arbitrary, visually center the labels and legend
             RP=c(.71,  .87),
             RL=c(.87, 1.00)),
           ...,
           QuestionName="Question",
           as.percent="Capture and then ignore this argument",
           positive.order=FALSE)
Arguments
ValueA Author(s)Richard M. Heiberger <rmh@temple.edu> See Also
Examples
## These are based on the Professional Challenges example in ?likert
data(ProfChal)

levels(ProfChal$Subtable)[6] <- "Prof Recog" ## reduce length of label

## See ?print.TwoTrellisColumns for this example using the original ordering

## Order both the plot of the count plot and the percent plot by the
## positive.order of the percent plot.

LikertPercentCountColumns(Question ~ . | Subtable, ProfChal,
                          layout=c(1,6), scales=list(y=list(relation="free")),
                          ylab=NULL, between=list(y=0),
                          strip.left=strip.custom(bg="gray97"), strip=FALSE,
                          par.strip.text=list(cex=.7),
                          positive.order=TRUE,
                          main="Is your job professionally challenging?")
## Not run:
## Retain original order of the Question variable

LikertPercentCountColumns(Question ~ . | Subtable, ProfChal,
                          layout=c(1,6), scales=list(y=list(relation="free")),
                          ylab=NULL, between=list(y=0),
                          strip.left=strip.custom(bg="gray97"), strip=FALSE,
                          par.strip.text=list(cex=.7),
                          main="Is your job professionally challenging?")

## Order both the plot of the count plot and the percent plot by the
## positive.order of the percent plot.
## Just the "Employment sector".
LPCCEs <-
LikertPercentCountColumns(Question ~ . ,
                          ProfChal[ProfChal$Subtable == "Employment sector", -7],
                          ylab=NULL, between=list(y=0),
                          par.strip.text=list(cex=.7),
                          positive.order=TRUE,
                          main="Is your job professionally challenging?\nEmployment sector",
                          px=list( ## defaults designed for long QuestionName values
                            LL=c(.00,  .50), ## and 7in x 7in window
                            LP=c(.49,  .70),
                            ML=c(.50,  .51),  ## arbitrary, visually center the labels and legend
                            RP=c(.71,  .84),
                            RL=c(.87, 1.00)))
LPCCEs$RP$x.scales$at <- c(0,100,200)
LPCCEs$RP$x.scales$labels <- c(0,100,200)
LPCCEs

## End(Not run)
Results
R version 3.3.1 (2016-06-21) -- "Bug in Your Hair"
Copyright (C) 2016 The R Foundation for Statistical Computing
Platform: x86_64-pc-linux-gnu (64-bit)

R is free software and comes with ABSOLUTELY NO WARRANTY.
You are welcome to redistribute it under certain conditions.
Type 'license()' or 'licence()' for distribution details.

R is a collaborative project with many contributors.
Type 'contributors()' for more information and
'citation()' on how to cite R or R packages in publications.

Type 'demo()' for some demos, 'help()' for on-line help, or
'help.start()' for an HTML browser interface to help.
Type 'q()' to quit R.

> library(HH)
Loading required package: lattice
Loading required package: grid
Loading required package: latticeExtra
Loading required package: RColorBrewer
Loading required package: multcomp
Loading required package: mvtnorm
Loading required package: survival
Loading required package: TH.data
Loading required package: MASS

Attaching package: 'TH.data'

The following object is masked from 'package:MASS':

    geyser

Loading required package: gridExtra
> png(filename="/home/ddbj/snapshot/RGM3/R_CC/result/HH/LikertPercentCountColumns.Rd_%03d_medium.png", width=480, height=480)
> ### Name: LikertPercentCountColumns
> ### Title: Display likert plots with percents in the first column of panels
> ###   and counts in the second column of panels.
> ### Aliases: LikertPercentCountColumns
> ### Keywords: hplot
>
> ### ** Examples
>
>
> ## These are based on the Professional Challenges example in ?likert
> data(ProfChal)
>
> levels(ProfChal$Subtable)[6] <- "Prof Recog" ## reduce length of label
>
> ## See ?print.TwoTrellisColumns for this example using the original ordering
>
> ## Order both the plot of the count plot and the percent plot by the
> ## positive.order of the percent plot.
>
> LikertPercentCountColumns(Question ~ . | Subtable, ProfChal,
+                           layout=c(1,6), scales=list(y=list(relation="free")),
+                           ylab=NULL, between=list(y=0),
+                           strip.left=strip.custom(bg="gray97"), strip=FALSE,
+                           par.strip.text=list(cex=.7),
+                           positive.order=TRUE,
+                           main="Is your job professionally challenging?")
> ## Not run:
> ##D ## Retain original order of the Question variable
> ##D
> ##D LikertPercentCountColumns(Question ~ . | Subtable, ProfChal,
> ##D                           layout=c(1,6), scales=list(y=list(relation="free")),
> ##D                           ylab=NULL, between=list(y=0),
> ##D                           strip.left=strip.custom(bg="gray97"), strip=FALSE,
> ##D                           par.strip.text=list(cex=.7),
> ##D                           main="Is your job professionally challenging?")
> ##D
> ##D ## Order both the plot of the count plot and the percent plot by the
> ##D ## positive.order of the percent plot.
> ##D ## Just the "Employment sector".
> ##D LPCCEs <-
> ##D LikertPercentCountColumns(Question ~ . ,
> ##D                           ProfChal[ProfChal$Subtable == "Employment sector", -7],
> ##D                           ylab=NULL, between=list(y=0),
> ##D                           par.strip.text=list(cex=.7),
> ##D                           positive.order=TRUE,
> ##D                           main="Is your job professionally challenging?\nEmployment sector",
> ##D                           px=list( ## defaults designed for long QuestionName values
> ##D                             LL=c(.00,  .50), ## and 7in x 7in window
> ##D                             LP=c(.49,  .70),
> ##D                             ML=c(.50,  .51),  ## arbitrary, visually center the labels and legend
> ##D                             RP=c(.71,  .84),
> ##D                             RL=c(.87, 1.00)))
> ##D LPCCEs$RP$x.scales$at <- c(0,100,200)
> ##D LPCCEs$RP$x.scales$labels <- c(0,100,200)
> ##D LPCCEs
> ## End(Not run)
>
>
>
>
>
> dev.off()
null device
          1
>
|