Supported by Dr. Osamu Ogasawara and  . . |
|
Last data update: 2014.03.03 |
Specify plots to illustrate Normal and t Hypothesis Tests or Confidence Intervals, including normal approximation to the binomial.DescriptionSpecify plots to illustrate Normal and t Hypothesis Tests or Confidence Intervals, including normal approximation to the binomial. Usage
NTplot(mean0, ...)
## Default S3 method:
NTplot(mean0=0, ..., shiny=FALSE,
        distribution.name = c("normal","z","t","binomial"))
## S3 method for class 'htest'
NTplot(mean0, ..., shiny=FALSE, NTmethod="htest")
## S3 method for class 'power.htest'
NTplot(mean0, ..., shiny=FALSE, xbar=NA, ## these input values are used
        mean1, n, df, sd, distribution.name, sub, ## these input values ignored
        alpha.left, alpha.right, number.vars) ## these input values ignored
        ## NTplot(NTplot(htest.object), n=20) ## allows override of arguments
## S3 method for class 'NormalAndTplot'
NTplot(mean0, ..., shiny=FALSE)
Arguments
DetailsThe graphs produced by this single function cover most of the first semester
introductory Statistics course.
All options of the
The shiny app (called when the argument When you have a graph on the shiny window that you wish to keep, click on the "Display Options" tab, and then on the "Display Call" radio button. The main shiny window will show an R command which will reproduce the current plot. Pick it up with the mouse and drop it into an R console window. To get out of the shiny window and return to an interactive R console,
move the cursor back to the console window and interrupt the shiny call, usually
by entering Value
NoteThis function is built on lattice and latticeExtra.
It supersedes the similar function
Author(s)Richard M. Heiberger (rmh@temple.edu) See Also
Examples
x1 <- rnorm(12)
x2 <- rnorm(12, mean=.5)
NT.object <- NTplot(mean0=0, mean1=1)
NT.object
attr(NT.object, "scales")
attr(NT.object, "prob")
cat(attr(NT.object, "call"), "\n") ## the cat() is needed to unescape embedded quotes.
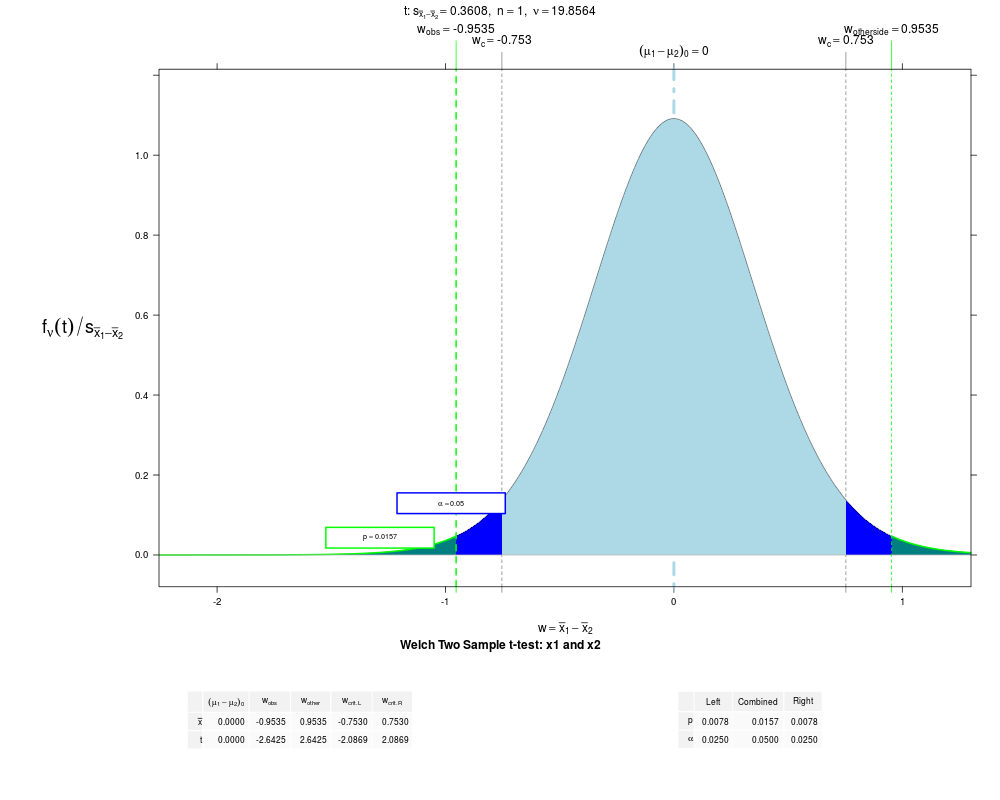
NTplot(t.test(x1, x2))
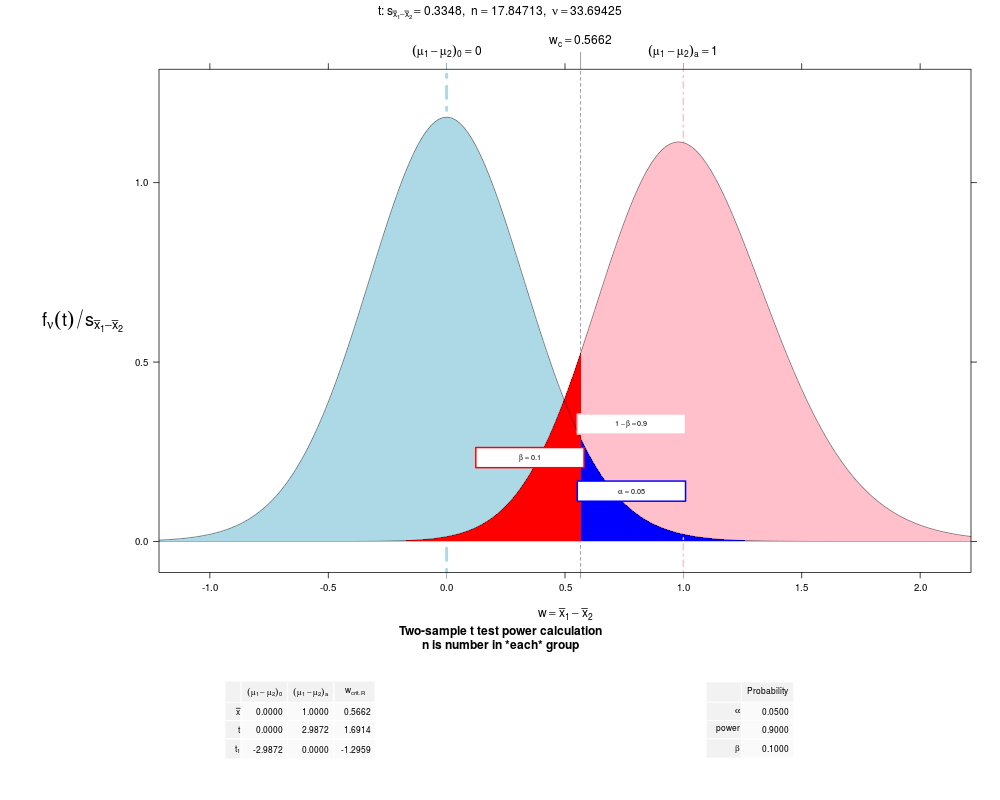
NTplot(power.t.test(power = .90, delta = 1, alternative = "one.sided"))
## Not run:
## 22 distinct calls are shown in
demo(NTplot, ask=FALSE)
## End(Not run)
## Not run: ## these are interactive and do not work in static checking of the code
NTplot(mean0=0, mean1=1, shiny=TRUE)
NTplot(shiny=TRUE, px.height=475) ## default value is 575
NTplot(t.test(x1, x2), shiny=TRUE, mean1=1)
NTplot(power.t.test(power = .90, delta = 1, alternative = "one.sided"), shiny=TRUE)
NTplot(NT.object, shiny=TRUE)
## run the shiny app
shiny::runApp(system.file("shiny/NTplot", package="HH"))
## End(Not run)
Results
R version 3.3.1 (2016-06-21) -- "Bug in Your Hair"
Copyright (C) 2016 The R Foundation for Statistical Computing
Platform: x86_64-pc-linux-gnu (64-bit)

R is free software and comes with ABSOLUTELY NO WARRANTY.
You are welcome to redistribute it under certain conditions.
Type 'license()' or 'licence()' for distribution details.

R is a collaborative project with many contributors.
Type 'contributors()' for more information and
'citation()' on how to cite R or R packages in publications.

Type 'demo()' for some demos, 'help()' for on-line help, or
'help.start()' for an HTML browser interface to help.
Type 'q()' to quit R.

> library(HH)
Loading required package: lattice
Loading required package: grid
Loading required package: latticeExtra
Loading required package: RColorBrewer
Loading required package: multcomp
Loading required package: mvtnorm
Loading required package: survival
Loading required package: TH.data
Loading required package: MASS

Attaching package: 'TH.data'

The following object is masked from 'package:MASS':

    geyser

Loading required package: gridExtra
> png(filename="/home/ddbj/snapshot/RGM3/R_CC/result/HH/NormalAndT.Rd_%03d_medium.png", width=480, height=480)
> ### Name: NTplot
> ### Title: Specify plots to illustrate Normal and t Hypothesis Tests or
> ###   Confidence Intervals, including normal approximation to the binomial.
> ### Aliases: NTplot NTplot.default NTplot.htest NTplot.power.htest
> ###   NTplot.NormalAndTplot
> ### Keywords: hplot shiny
>
> ### ** Examples
>
> x1 <- rnorm(12)
> x2 <- rnorm(12, mean=.5)
>
> NT.object <- NTplot(mean0=0, mean1=1)
> NT.object
> attr(NT.object, "scales")
            mu[0]      mu[a]  w[crit.R]
bar(x)  0.0000000  1.0000000  1.6448536
z       0.0000000  1.0000000  1.6448536
z[1]   -1.0000000  0.0000000  0.6448536
> attr(NT.object, "prob")
      Probability
alpha    0.050000
power    0.259511
beta     0.740489
> cat(attr(NT.object, "call"), "\n") ## the cat() is needed to unescape embedded quotes.
NTplot(mean0=0, mean1=1, xbar=NA, df=Inf, n=1, sd=1, xlim=c(-3,4), ylim=c(0,0.41489997161749), alpha.right=0.05, alpha.left=0, float=TRUE, ntcolors="original", digits=4, distribution.name="normal", type="hypothesis", zaxis=FALSE, z1axis=FALSE, cex.z=0.5, cex.prob=0.6, main=expression("normal: " * sigma[bar(x)] == "1" * ", " ~ n == 1), xlab=expression(w == bar(x)), prob.labels=TRUE, number.vars=1, sub=NULL, NTmethod="default", power=FALSE, beta=FALSE)
>
> NTplot(t.test(x1, x2))
> NTplot(power.t.test(power = .90, delta = 1, alternative = "one.sided"))
>
> ## Not run:
> ##D ## 22 distinct calls are shown in
> ##D demo(NTplot, ask=FALSE)
> ## End(Not run)
>
> ## Not run:
> ##D  ## these are interactive and do not work in static checking of the code
> ##D NTplot(mean0=0, mean1=1, shiny=TRUE)
> ##D NTplot(shiny=TRUE, px.height=475) ## default value is 575
> ##D NTplot(t.test(x1, x2), shiny=TRUE, mean1=1)
> ##D NTplot(power.t.test(power = .90, delta = 1, alternative = "one.sided"), shiny=TRUE)
> ##D NTplot(NT.object, shiny=TRUE)
> ##D
> ##D ## run the shiny app
> ##D shiny::runApp(system.file("shiny/NTplot", package="HH"))
> ## End(Not run)
>
>
>
>
>
>
> dev.off()
null device
          1
>
|