Supported by Dr. Osamu Ogasawara and  . . |
|
Last data update: 2014.03.03 |
Display multiple independent trellis objects on the same coordinated scale.DescriptionThis function is a wrapper for several of the functions in the
Usage
ResizeEtc(c.list,
           condlevelsName,
           x.same, y.same,
           layout,
           strip=TRUE,
           strip.left=TRUE,
           strip.values, strip.left.values,
           strip.par, strip.left.par,  ## only the second is effective
                                       ## when both are specified
           resize.height, resize.width,
           main,
           ...)
Arguments
Value
Author(s)Richard M. Heiberger <rmh@temple.edu> See Also
Examples
## see the examples in ?HH:::plot.likert
require(grid)
require(lattice)
require(latticeExtra)
require(HH)
## This is the same example as in ?HH:::plot.likert
## Here, it is done with explicit use of ResizeEtc.
data(ProfChal)
tmp <- data.matrix(ProfChal[,1:5])
rownames(tmp) <- ProfChal$Question
AA <- likert(tmp[1,], box.width=unit(.4,"cm"), positive.order=TRUE)
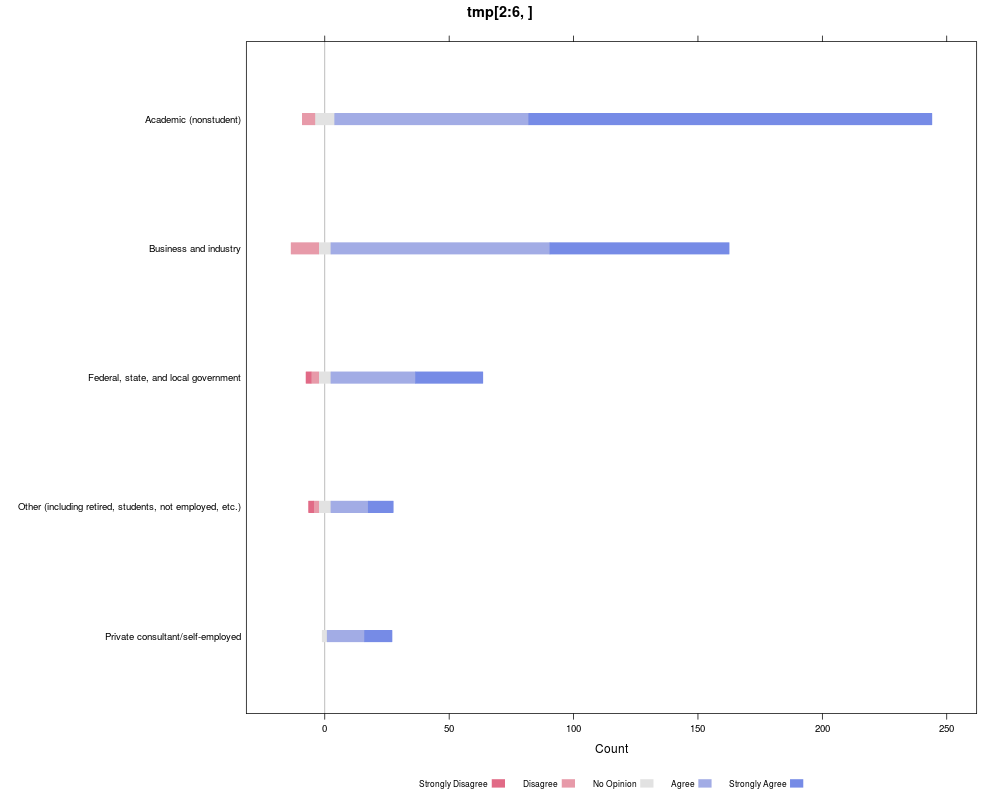
BB <- likert(tmp[2:6,], box.width=unit(.4,"cm"), positive.order=TRUE)
CC <- likert(tmp[7:10,], box.width=unit(.4,"cm"), positive.order=TRUE)
DD <- likert(tmp[11:12,], box.width=unit(.4,"cm"), positive.order=TRUE)
EE <- likert(tmp[13:14,], box.width=unit(.4,"cm"), positive.order=TRUE)
FF <- likert(tmp[15:16,], box.width=unit(.4,"cm"), positive.order=TRUE)
BB
## print(AA, more=TRUE, split=c(1,1,3,2))
## print(BB, more=TRUE, split=c(2,1,3,2))
## print(CC, more=TRUE, split=c(3,1,3,2))
## print(DD, more=TRUE, split=c(1,2,3,2))
## print(EE, more=TRUE, split=c(2,2,3,2))
## print(FF, more=FALSE, split=c(3,2,3,2))
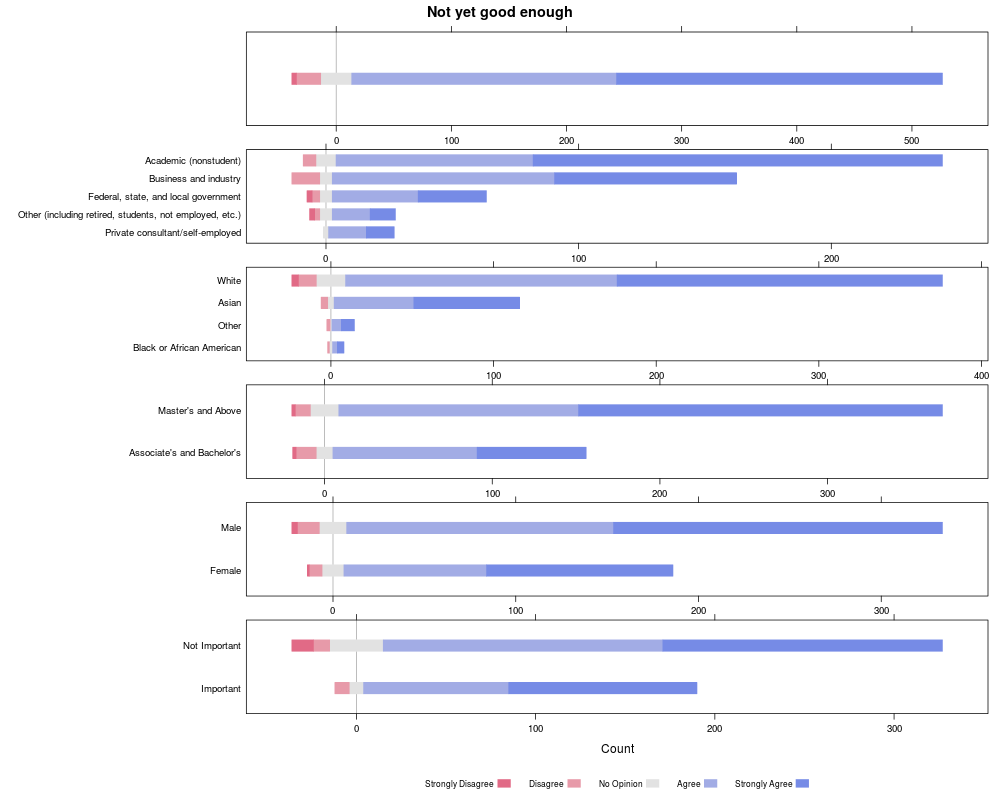
ResizeEtc(c.list=c(AA,BB,CC,DD,EE,FF),
layout=c(1,6), main="Not yet good enough")
Group <- levels(ProfChal$Subtable)
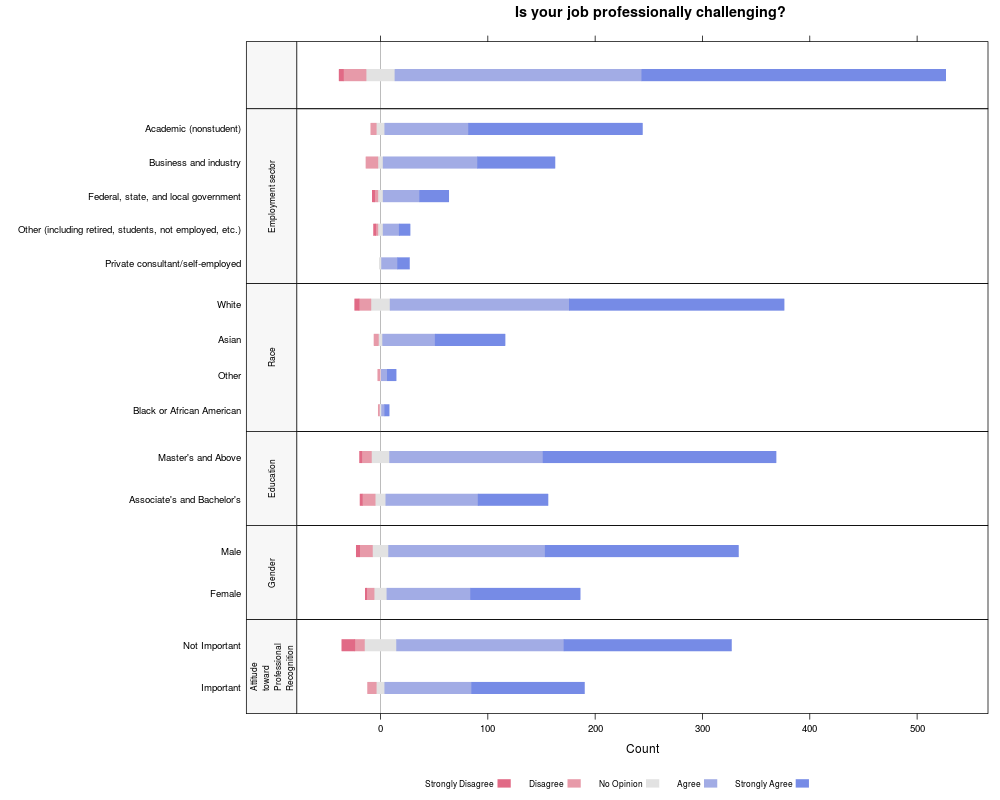
ResizeEtc(c.list=c(AA,BB,CC,DD,EE,FF),
condlevelsName='Group',
x.same=TRUE,
layout=c(1,6),
strip.left.values=Group,
strip.left.par=list(cex=.7, lines=5),
resize.height=c(1,5,4,2,2,2)+.5,
main=list("Is your job professionally challenging?", x=unit(.65, "npc")))
Results
R version 3.3.1 (2016-06-21) -- "Bug in Your Hair"
Copyright (C) 2016 The R Foundation for Statistical Computing
Platform: x86_64-pc-linux-gnu (64-bit)

R is free software and comes with ABSOLUTELY NO WARRANTY.
You are welcome to redistribute it under certain conditions.
Type 'license()' or 'licence()' for distribution details.

R is a collaborative project with many contributors.
Type 'contributors()' for more information and
'citation()' on how to cite R or R packages in publications.

Type 'demo()' for some demos, 'help()' for on-line help, or
'help.start()' for an HTML browser interface to help.
Type 'q()' to quit R.

> library(HH)
Loading required package: lattice
Loading required package: grid
Loading required package: latticeExtra
Loading required package: RColorBrewer
Loading required package: multcomp
Loading required package: mvtnorm
Loading required package: survival
Loading required package: TH.data
Loading required package: MASS

Attaching package: 'TH.data'

The following object is masked from 'package:MASS':

    geyser

Loading required package: gridExtra
> png(filename="/home/ddbj/snapshot/RGM3/R_CC/result/HH/ResizeEtc.Rd_%03d_medium.png", width=480, height=480)
> ### Name: ResizeEtc
> ### Title: Display multiple independent trellis objects on the same
> ###   coordinated scale.
> ### Aliases: ResizeEtc
> ### Keywords: hplot
>
> ### ** Examples
>
> ## see the examples in ?HH:::plot.likert
>
> require(grid)
> require(lattice)
> require(latticeExtra)
> require(HH)
>
> ## This is the same example as in ?HH:::plot.likert
> ## Here, it is done with explicit use of ResizeEtc.
>
> data(ProfChal)
> tmp <- data.matrix(ProfChal[,1:5])
> rownames(tmp) <- ProfChal$Question
>
> AA <- likert(tmp[1,], box.width=unit(.4,"cm"), positive.order=TRUE)
> BB <- likert(tmp[2:6,], box.width=unit(.4,"cm"), positive.order=TRUE)
> CC <- likert(tmp[7:10,], box.width=unit(.4,"cm"), positive.order=TRUE)
> DD <- likert(tmp[11:12,], box.width=unit(.4,"cm"), positive.order=TRUE)
> EE <- likert(tmp[13:14,], box.width=unit(.4,"cm"), positive.order=TRUE)
> FF <- likert(tmp[15:16,], box.width=unit(.4,"cm"), positive.order=TRUE)
>
> BB
>
> ## print(AA, more=TRUE,  split=c(1,1,3,2))
> ## print(BB, more=TRUE,  split=c(2,1,3,2))
> ## print(CC, more=TRUE,  split=c(3,1,3,2))
> ## print(DD, more=TRUE,  split=c(1,2,3,2))
> ## print(EE, more=TRUE,  split=c(2,2,3,2))
> ## print(FF, more=FALSE, split=c(3,2,3,2))
>
> ResizeEtc(c.list=c(AA,BB,CC,DD,EE,FF),
+           layout=c(1,6), main="Not yet good enough")
>
> Group <- levels(ProfChal$Subtable)
>
> ResizeEtc(c.list=c(AA,BB,CC,DD,EE,FF),
+           condlevelsName='Group',
+           x.same=TRUE,
+           layout=c(1,6),
+           strip.left.values=Group,
+           strip.left.par=list(cex=.7, lines=5),
+           resize.height=c(1,5,4,2,2,2)+.5,
+           main=list("Is your job professionally challenging?", x=unit(.65, "npc")))
>
>
>
>
>
>
>
> dev.off()
null device
          1
>
|