Supported by Dr. Osamu Ogasawara and  . . |
|
Last data update: 2014.03.03 |
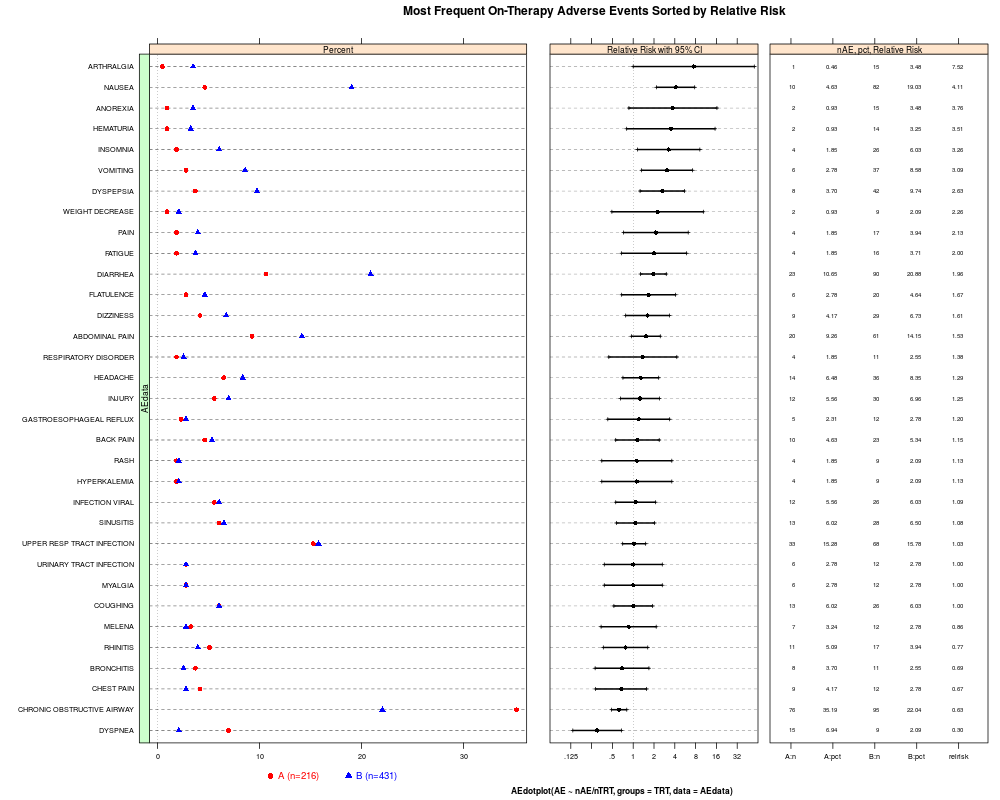
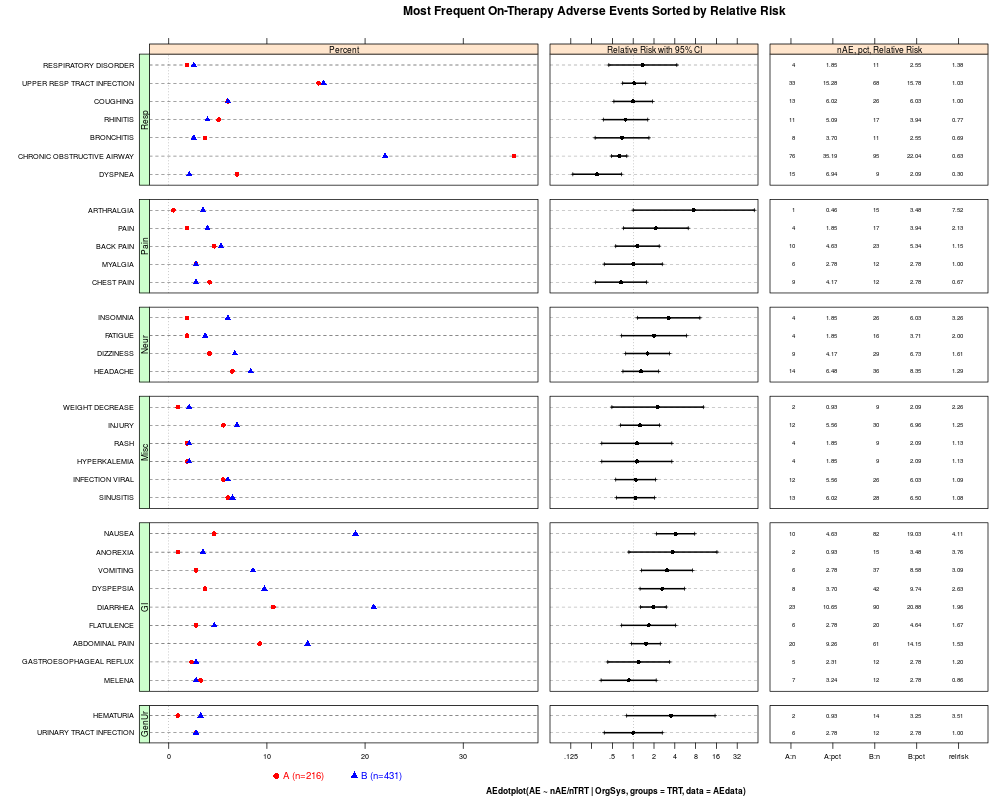
AE (Adverse Events) dotplot of incidence and relative riskDescriptionA three-panel display of the most
frequently occurring AEs in the active arm of a clinical
study. The first panel displays their incidence by
treatment group, with different symbols for each
group. The second panel displays the relative risk
of an event on the active arm relative to the
placebo arm, with 95% confidence intervals for a 2x2 table.
By default, the AEs are ordered by
relative risk so that events with the largest
increases in risk for the active treatment are
prominent at the top of the display.
By setting the argument Usage
  AEdotplot(xr, ...)

  ## S3 method for class 'formula'
AEdotplot(xr, groups=NULL, data=NULL,
          sortbyRelativeRisk=TRUE,
          ...,
          sub=list(deparse(this.call[1:4],
                                width.cutoff=500), cex=.7))
Arguments
DetailsThe first panel is an ordinary dotplot of the percent of AE observed for each treatment by AE. The second panel shows relative risk of an event on the Treatment B arm (usually the active compound) relative to the Treatment A arm (usually the placebo), with 95% confidence intervals for a 2x2 table. Confidence intervals on the log relative risk are calculated using the asymptotic standard error formula given as Equation 3.18 in Agresti A., Categorical Data Analysis. Wiley: New York, 1990. By default the The third panel shows the numerical values of the number and percent
of observed events on each arm and the relative risk.
The display of third panel can be suppressed by specifying the
ValueThe primary interest is in the display of the plot. The function returns
an
NoteAnn Liu-Ferrara was a beta tester for the shiny app. Author(s)Richard M. Heiberger <rmh@temple.edu> ReferencesOhad Amit, Richard M. Heiberger, and Peter W. Lane. (2008) “Graphical Approaches to the Analysis of Safety Data from Clinical Trials”. Pharmaceutical Statistics, 7, 1, 20–35. http://www3.interscience.wiley.com/journal/114129388/abstract See Also
Examples
## formula method.  See ?AEdotplot.data.frame for other methods.
data(AEdata)
head(AEdata)

AEdotplot(AE ~ nAE/nTRT, groups = TRT, data = AEdata)           ## sort by Relative Risk
AEdotplot(AE ~ nAE/nTRT | OrgSys, groups = TRT, data = AEdata)  ## conditioned on Organ System

## Not run:
AEdotplot(AE ~ nAE/nTRT, groups = TRT, data = AEdata, sortbyVar="PCT")                   ## PCT A
AEdotplot(AE ~ nAE/nTRT, groups = TRT, data = AEdata, sortbyVar="PCT", sortbyVarBegin=2) ## PCT B
AEdotplot(AE ~ nAE/nTRT, groups = TRT, data = AEdata, sortbyRelativeRisk=FALSE)     ## levels(AE)
AEdotplot(AE ~ nAE/nTRT | OrgSys, groups = TRT, data = AEdata, sortbyVar="ase.logrelrisk")

## End(Not run)


## Not run:


AEdotplot(AE ~ nAE/nTRT | OrgSys, groups = TRT,
          data = AEdata[c(AEdata$OrgSys %in% c("GI","Resp")),])

## test sortbyRelativeRisk=FALSE
ABCD.12345 <- AEdata[1:12,]
head(ABCD.12345)
AEdotplot(AE ~ nAE/nTRT | OrgSys, groups=TRT, data=ABCD.12345)
AEdotplot(AE ~ nAE/nTRT | OrgSys, groups=TRT, data=ABCD.12345, sort=FALSE)

## suppress third panel
tmp <- AEdotplot(AE ~ nAE/nTRT, groups = TRT, data = AEdata)
print(tmp, AEtable=FALSE)

## End(Not run)

## Not run:
  ## run the shiny app
  shiny::runApp(system.file("shiny/AEdotplot", package="HH"))

## End(Not run)
Results
R version 3.3.1 (2016-06-21) -- "Bug in Your Hair"
Copyright (C) 2016 The R Foundation for Statistical Computing
Platform: x86_64-pc-linux-gnu (64-bit)

R is free software and comes with ABSOLUTELY NO WARRANTY.
You are welcome to redistribute it under certain conditions.
Type 'license()' or 'licence()' for distribution details.

R is a collaborative project with many contributors.
Type 'contributors()' for more information and
'citation()' on how to cite R or R packages in publications.

Type 'demo()' for some demos, 'help()' for on-line help, or
'help.start()' for an HTML browser interface to help.
Type 'q()' to quit R.

> library(HH)
Loading required package: lattice
Loading required package: grid
Loading required package: latticeExtra
Loading required package: RColorBrewer
Loading required package: multcomp
Loading required package: mvtnorm
Loading required package: survival
Loading required package: TH.data
Loading required package: MASS

Attaching package: 'TH.data'

The following object is masked from 'package:MASS':

    geyser

Loading required package: gridExtra
> png(filename="/home/ddbj/snapshot/RGM3/R_CC/result/HH/ae.dotplot7a.Rd_%03d_medium.png", width=480, height=480)
> ### Name: AEdotplot
> ### Title: AE (Adverse Events) dotplot of incidence and relative risk
> ### Aliases: AEdotplot AEdotplot.formula
> ### Keywords: hplot htest
>
> ### ** Examples
>
> ## formula method.  See ?AEdotplot.data.frame for other methods.
> data(AEdata)
> head(AEdata)
  TRT           AE nAE nTRT OrgSys
1   A      DYSPNEA  15  216   Resp
2   B      DYSPNEA   9  431   Resp
3   A HYPERKALEMIA   4  216   Misc
4   B HYPERKALEMIA   9  431   Misc
5   A         RASH   4  216   Misc
6   B         RASH   9  431   Misc
>
> AEdotplot(AE ~ nAE/nTRT, groups = TRT, data = AEdata)           ## sort by Relative Risk
> AEdotplot(AE ~ nAE/nTRT | OrgSys, groups = TRT, data = AEdata)  ## conditioned on Organ System
>
> ## Not run:
> ##D AEdotplot(AE ~ nAE/nTRT, groups = TRT, data = AEdata, sortbyVar="PCT")                   ## PCT A
> ##D AEdotplot(AE ~ nAE/nTRT, groups = TRT, data = AEdata, sortbyVar="PCT", sortbyVarBegin=2) ## PCT B
> ##D AEdotplot(AE ~ nAE/nTRT, groups = TRT, data = AEdata, sortbyRelativeRisk=FALSE)     ## levels(AE)
> ##D AEdotplot(AE ~ nAE/nTRT | OrgSys, groups = TRT, data = AEdata, sortbyVar="ase.logrelrisk")
> ## End(Not run)
>
>
> ## Not run:
> ##D
> ##D
> ##D AEdotplot(AE ~ nAE/nTRT | OrgSys, groups = TRT,
> ##D           data = AEdata[c(AEdata$OrgSys %in% c("GI","Resp")),])
> ##D
> ##D ## test sortbyRelativeRisk=FALSE
> ##D ABCD.12345 <- AEdata[1:12,]
> ##D head(ABCD.12345)
> ##D AEdotplot(AE ~ nAE/nTRT | OrgSys, groups=TRT, data=ABCD.12345)
> ##D AEdotplot(AE ~ nAE/nTRT | OrgSys, groups=TRT, data=ABCD.12345, sort=FALSE)
> ##D
> ##D ## suppress third panel
> ##D tmp <- AEdotplot(AE ~ nAE/nTRT, groups = TRT, data = AEdata)
> ##D print(tmp, AEtable=FALSE)
> ## End(Not run)
>
> ## Not run:
> ##D   ## run the shiny app
> ##D   shiny::runApp(system.file("shiny/AEdotplot", package="HH"))
> ## End(Not run)
>
>
>
>
>
>
> dev.off()
null device
          1
>
|