Supported by Dr. Osamu Ogasawara and  . . |
|
Last data update: 2014.03.03 |
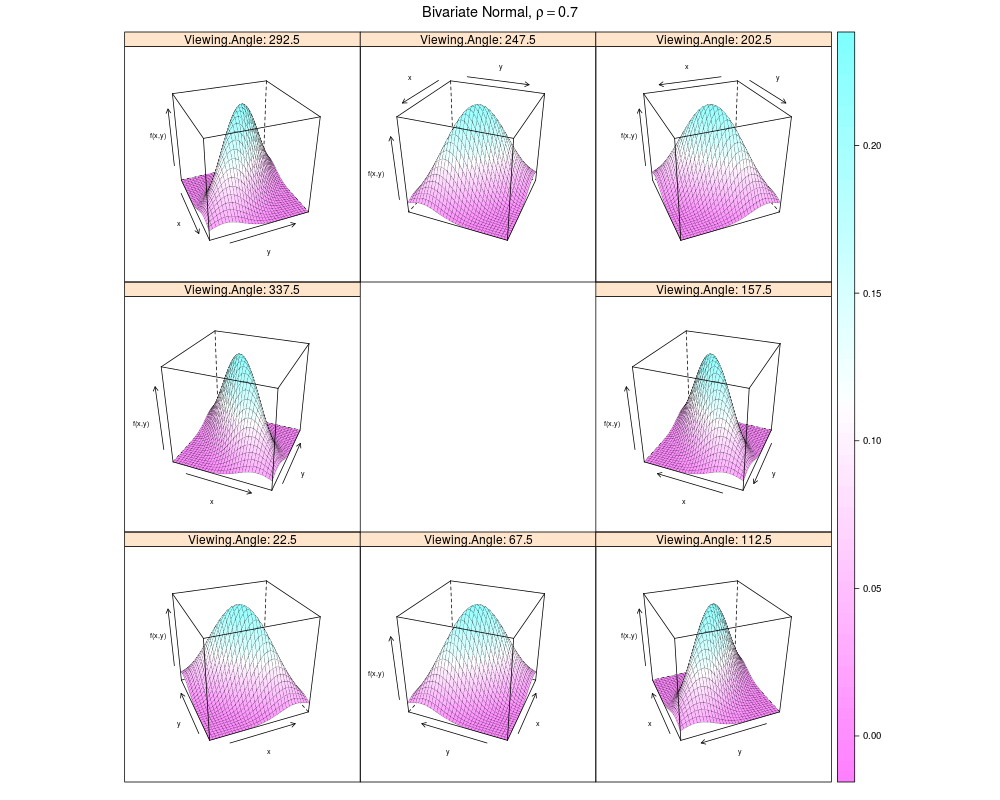
Plot the bivariate normal density using wireframe for specified rho.DescriptionPlot the bivariate normal density using wireframe for specified rho. There is a shiny app that allows this to be done dynamically. Usage
bivariateNormal(rho = 0, layout = c(3, 3), lwd = 0.2,
                angle = c(22.5, 67.5, 112.5, 337.5, 157.5, 292.5, 247.5, 202.5),
                col.regions = trellis.par.get("regions")$col, ...)
Arguments
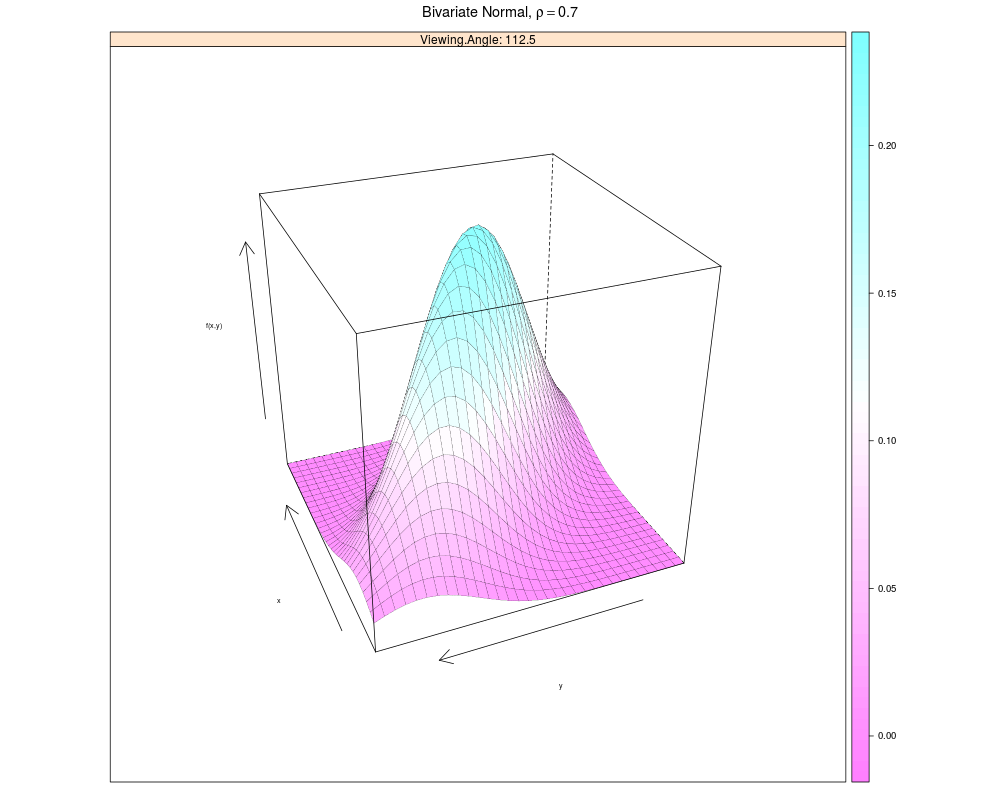
DetailsThe default setting shows the view as seen from a series of eight angles. To see just a single view, see the example. Value
NoteBased on the Author(s)Richard M. Heiberger (rmh@temple.edu) Examples
bv8 <- bivariateNormal(.7)  ## all views on one page
bv8
update(bv8[3], layout=c(1,1)) ## one panel
## Not run:
  shiny::runApp(file.path(system.file(package="HH"), "shiny/bivariateNormal")) ## 3D
  shiny::runApp(system.file("shiny/bivariateNormalScatterplot", package="HH")) ## scatterplota

## End(Not run)
Results
R version 3.3.1 (2016-06-21) -- "Bug in Your Hair"
Copyright (C) 2016 The R Foundation for Statistical Computing
Platform: x86_64-pc-linux-gnu (64-bit)

R is free software and comes with ABSOLUTELY NO WARRANTY.
You are welcome to redistribute it under certain conditions.
Type 'license()' or 'licence()' for distribution details.

R is a collaborative project with many contributors.
Type 'contributors()' for more information and
'citation()' on how to cite R or R packages in publications.

Type 'demo()' for some demos, 'help()' for on-line help, or
'help.start()' for an HTML browser interface to help.
Type 'q()' to quit R.

> library(HH)
Loading required package: lattice
Loading required package: grid
Loading required package: latticeExtra
Loading required package: RColorBrewer
Loading required package: multcomp
Loading required package: mvtnorm
Loading required package: survival
Loading required package: TH.data
Loading required package: MASS

Attaching package: 'TH.data'

The following object is masked from 'package:MASS':

    geyser

Loading required package: gridExtra
> png(filename="/home/ddbj/snapshot/RGM3/R_CC/result/HH/bivariateNormal.Rd_%03d_medium.png", width=480, height=480)
> ### Name: bivariateNormal
> ### Title: Plot the bivariate normal density using wireframe for specified
> ###   rho.
> ### Aliases: bivariateNormal
> ### Keywords: hplot shiny
>
> ### ** Examples
>
> bv8 <- bivariateNormal(.7)  ## all views on one page
> bv8
> update(bv8[3], layout=c(1,1)) ## one panel
> ## Not run:
> ##D   shiny::runApp(file.path(system.file(package="HH"), "shiny/bivariateNormal")) ## 3D
> ##D   shiny::runApp(system.file("shiny/bivariateNormalScatterplot", package="HH")) ## scatterplota
> ## End(Not run)
>
>
>
>
>
> dev.off()
null device
          1
>
|
Created & Maintained by Osamu Ogasawara (osamu.ogasawara@gmail.com) and 