Supported by Dr. Osamu Ogasawara and  . . |
|
Last data update: 2014.03.03 |
Homogeneity of Variance: Brown–Forsyth methodDescriptionHomogeneity of Variance: Brown–Forsyth method Usage
hovBF(x, data = sys.parent(), ..., na.rm = TRUE)
hovplotBF(x, data, ..., na.rm = TRUE,
          main = "Brown-Forsyth Homogeneity of Variance", plotmath = TRUE)
Arguments
Value
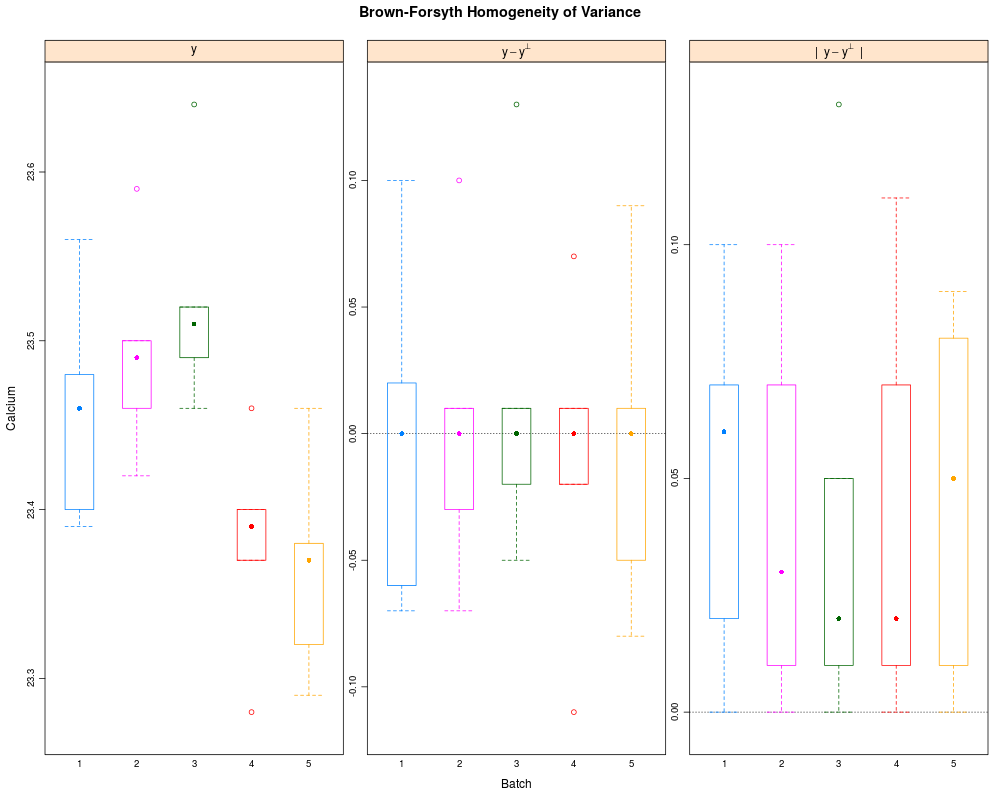
Author(s)Richard M. Heiberger <rmh@temple.edu> ReferencesBrown, M.~B. and Forsyth, A.~B. (1974). “Robust tests for equality of variances.” Journal of the American Statistical Association, 69:364–367. Examplesdata(batch) batch1.aov <- aov(Calcium ~ Batch, data=batch) anova(batch1.aov) hovBF(Calcium ~ Batch, data=batch) hovplotBF(Calcium ~ Batch, data=batch) Results
R version 3.3.1 (2016-06-21) -- "Bug in Your Hair"
Copyright (C) 2016 The R Foundation for Statistical Computing
Platform: x86_64-pc-linux-gnu (64-bit)

R is free software and comes with ABSOLUTELY NO WARRANTY.
You are welcome to redistribute it under certain conditions.
Type 'license()' or 'licence()' for distribution details.

R is a collaborative project with many contributors.
Type 'contributors()' for more information and
'citation()' on how to cite R or R packages in publications.

Type 'demo()' for some demos, 'help()' for on-line help, or
'help.start()' for an HTML browser interface to help.
Type 'q()' to quit R.

> library(HH)
Loading required package: lattice
Loading required package: grid
Loading required package: latticeExtra
Loading required package: RColorBrewer
Loading required package: multcomp
Loading required package: mvtnorm
Loading required package: survival
Loading required package: TH.data
Loading required package: MASS

Attaching package: 'TH.data'

The following object is masked from 'package:MASS':

    geyser

Loading required package: gridExtra
> png(filename="/home/ddbj/snapshot/RGM3/R_CC/result/HH/hovBF.Rd_%03d_medium.png", width=480, height=480)
> ### Name: hovBF
> ### Title: Homogeneity of Variance: Brown-Forsyth method
> ### Aliases: hovBF hovplotBF
> ### Keywords: dplot
>
> ### ** Examples
>
> data(batch)
> batch1.aov <- aov(Calcium ~ Batch, data=batch)
> anova(batch1.aov)
Analysis of Variance Table

Response: Calcium
          Df   Sum Sq  Mean Sq F value   Pr(>F)
Batch      4 0.096976 0.024244  5.5352 0.003626 **
Residuals 20 0.087600 0.004380
---
Signif. codes:  0 '***' 0.001 '**' 0.01 '*' 0.05 '.' 0.1 ' ' 1
> hovBF(Calcium ~ Batch, data=batch)

	hov: Brown-Forsyth

data:  Calcium
F = 0.032193, df:Batch = 4, df:Residuals = 20, p-value = 0.9978
alternative hypothesis: variances are not identical

> hovplotBF(Calcium ~ Batch, data=batch)
>
>
>
>
>
> dev.off()
null device
          1
>
|
Created & Maintained by Osamu Ogasawara (osamu.ogasawara@gmail.com) and 