Supported by Dr. Osamu Ogasawara and  . . |
|
Last data update: 2014.03.03 |
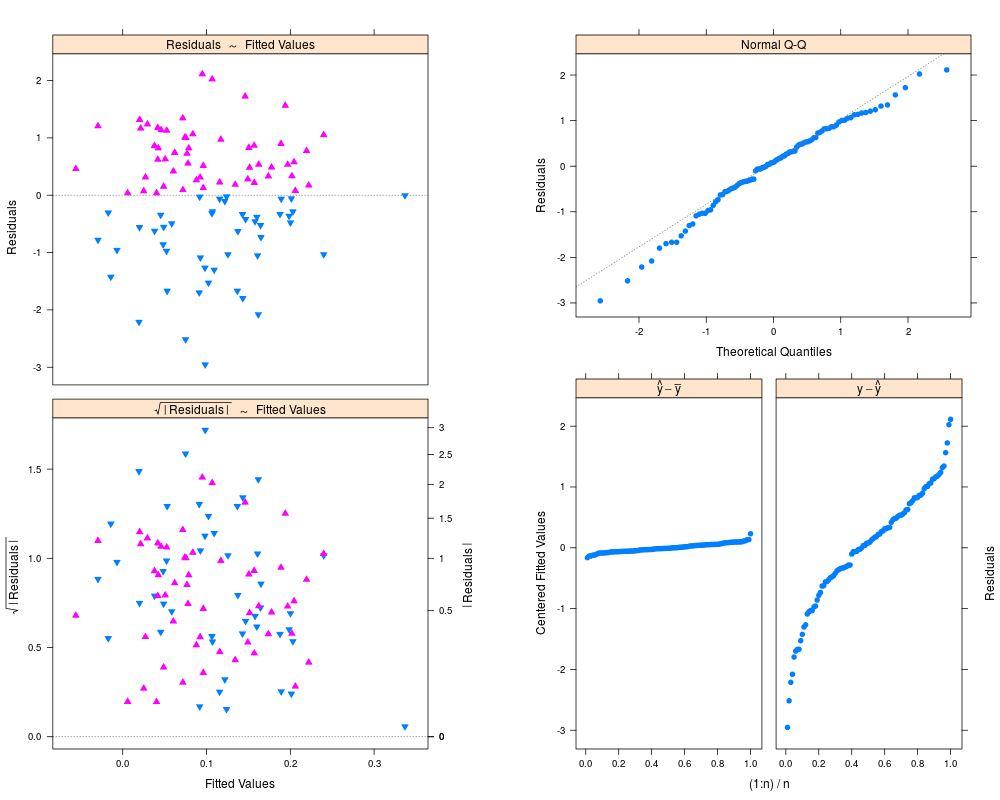
Four types of residual plots for linear models.DescriptionFour types of residual plots for linear models. The first three are redesigns of
plots that Usage
lmplot(lm.object, ..., main=NULL,
       col=trellis.par.get("superpose.symbol")$col[1:2],
       ylim=NULL)
Arguments
DetailsThe trellis plots from the four functions ValueA list of three trellis objects is returned invisibly, the first
contains the result of Author(s)Richard M. Heiberger <rmh@temple.edu> See Also
Examplestmp <- data.frame(y=rnorm(100), x1=rnorm(100), x2=rnorm(100)) tmp.lm <- lm(y ~ x1 + x2, data=tmp) lmplot(tmp.lm) Results
R version 3.3.1 (2016-06-21) -- "Bug in Your Hair"
Copyright (C) 2016 The R Foundation for Statistical Computing
Platform: x86_64-pc-linux-gnu (64-bit)

R is free software and comes with ABSOLUTELY NO WARRANTY.
You are welcome to redistribute it under certain conditions.
Type 'license()' or 'licence()' for distribution details.

R is a collaborative project with many contributors.
Type 'contributors()' for more information and
'citation()' on how to cite R or R packages in publications.

Type 'demo()' for some demos, 'help()' for on-line help, or
'help.start()' for an HTML browser interface to help.
Type 'q()' to quit R.

> library(HH)
Loading required package: lattice
Loading required package: grid
Loading required package: latticeExtra
Loading required package: RColorBrewer
Loading required package: multcomp
Loading required package: mvtnorm
Loading required package: survival
Loading required package: TH.data
Loading required package: MASS

Attaching package: 'TH.data'

The following object is masked from 'package:MASS':

    geyser

Loading required package: gridExtra
> png(filename="/home/ddbj/snapshot/RGM3/R_CC/result/HH/lmplot.Rd_%03d_medium.png", width=480, height=480)
> ### Name: lmplot
> ### Title: Four types of residual plots for linear models.
> ### Aliases: lmplot
> ### Keywords: dplot
>
> ### ** Examples
>
> tmp <- data.frame(y=rnorm(100), x1=rnorm(100), x2=rnorm(100))
> tmp.lm <- lm(y ~ x1 + x2, data=tmp)
> lmplot(tmp.lm)
>
>
>
>
>
> dev.off()
null device
          1
>
|