Supported by Dr. Osamu Ogasawara and  . . |
|
Last data update: 2014.03.03 |
Convert a one-dimensional trellis object to a two-dimensional trellis object. This permits combineLimits and useOuterStrips to work.Descriptionmatrix.trellis Usagematrix.trellis(x = NA, nrow = 1, ncol = 1, byrow = FALSE, dimnames = NULL) ## S3 method for class 'trellis' as.matrix(x, ..., row = FALSE, yname) Arguments
Details
Value
Author(s)Richard M. Heiberger <rmh@temple.edu> Examples
tmp <- data.frame(a=1:3,
b=c(4,5,7),
c=5:7,
d=c(8, 9, 12),
e=9:11)
tmp
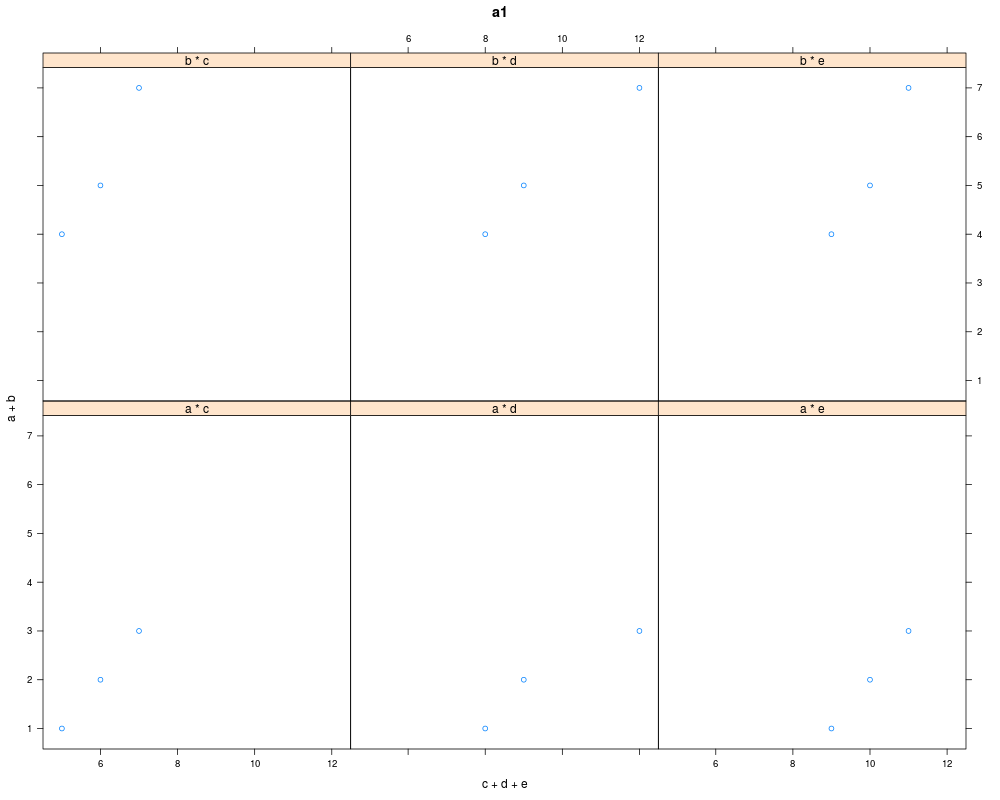
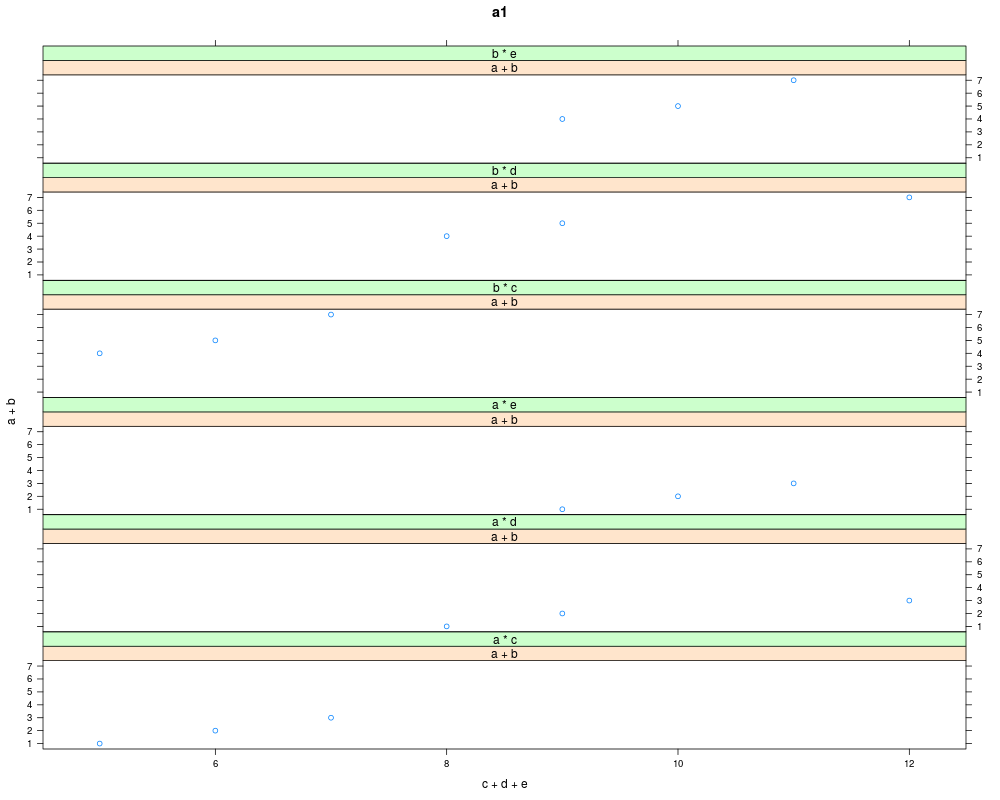
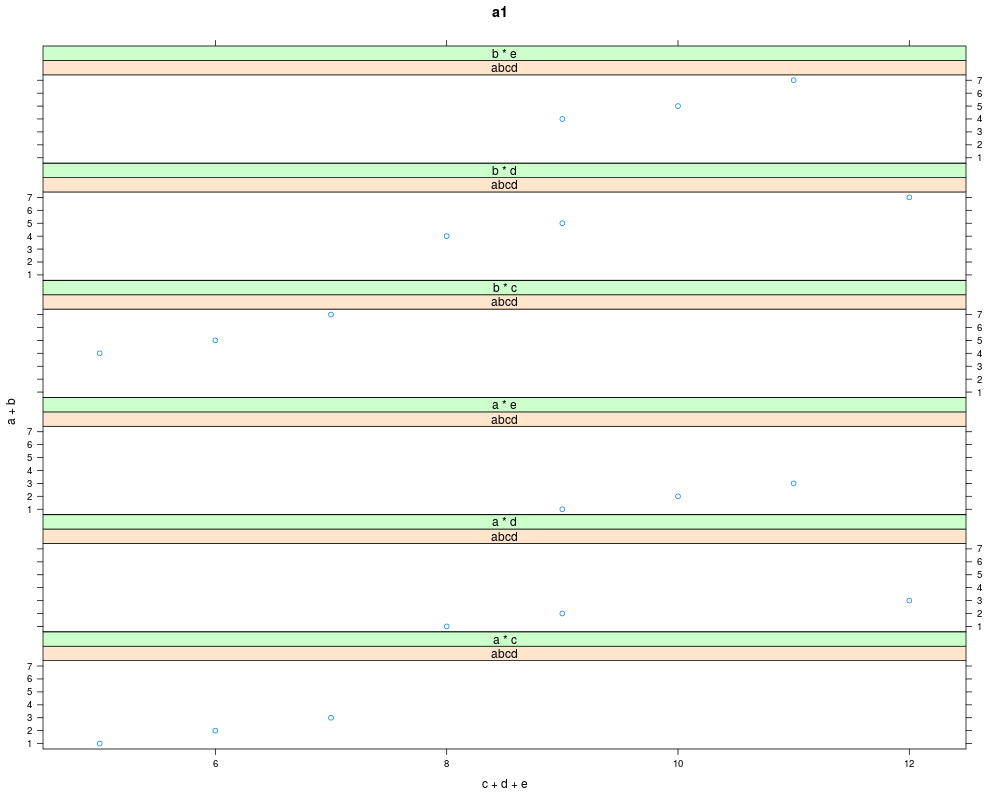
a1 <- xyplot(a + b ~ c + d + e, data=tmp, outer=TRUE,
main="a1")
a1
dim(a1)
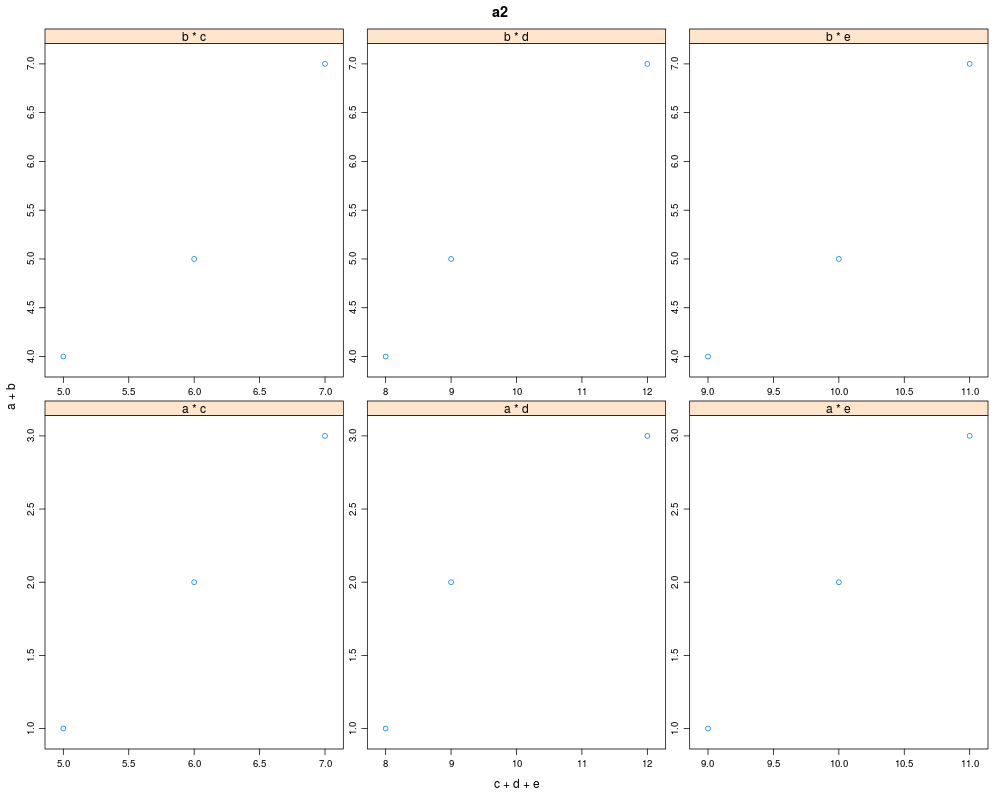
a2 <- xyplot(a + b ~ c + d + e, data=tmp, outer=TRUE,
scales=list(relation="free"), main="a2")
a2
dim(a2)
try(combineLimits(a2))
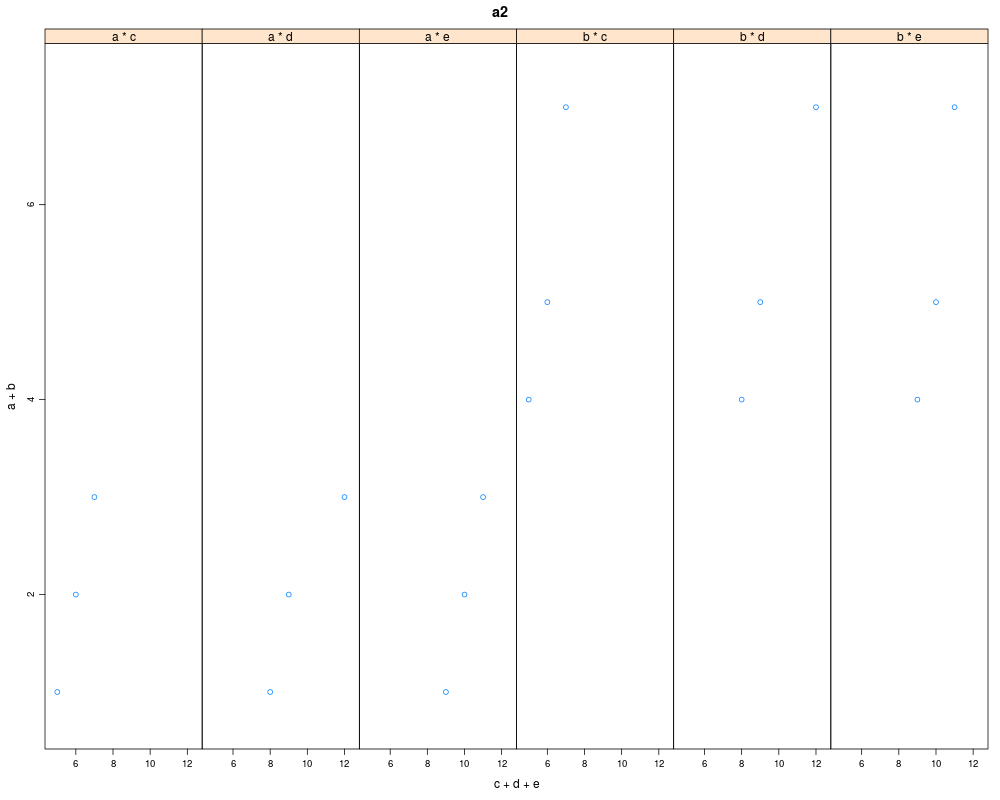
combineLimits.trellisvector(a2)
combineLimits.trellisvector(update(a2, layout=c(3,2)))
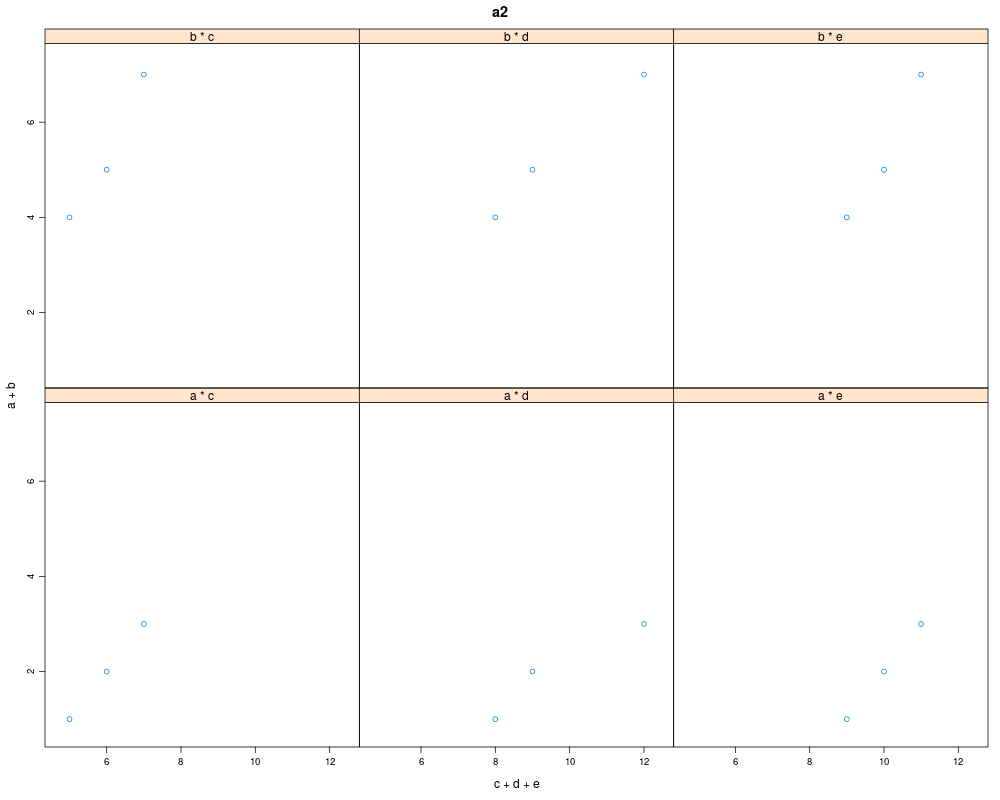
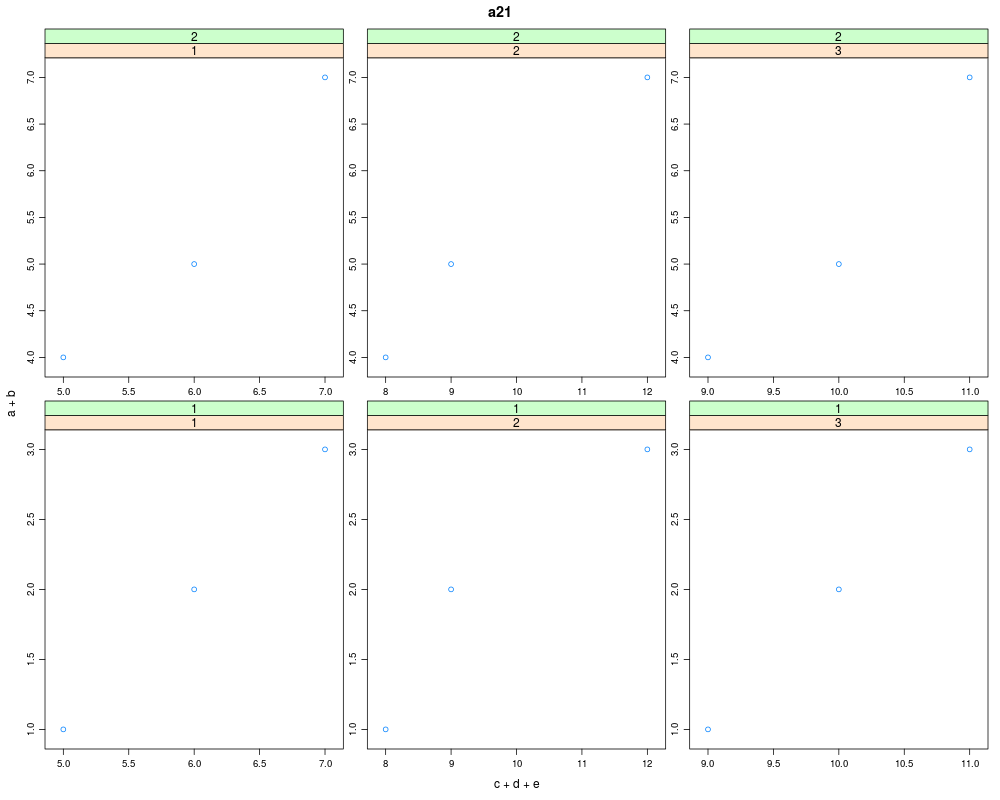
a21 <- matrix.trellis(a2, ncol=3, nrow=2, byrow=TRUE)
a21 <- update(a21, main="a21")
a21
dim(a21)
a21$x.scales$at
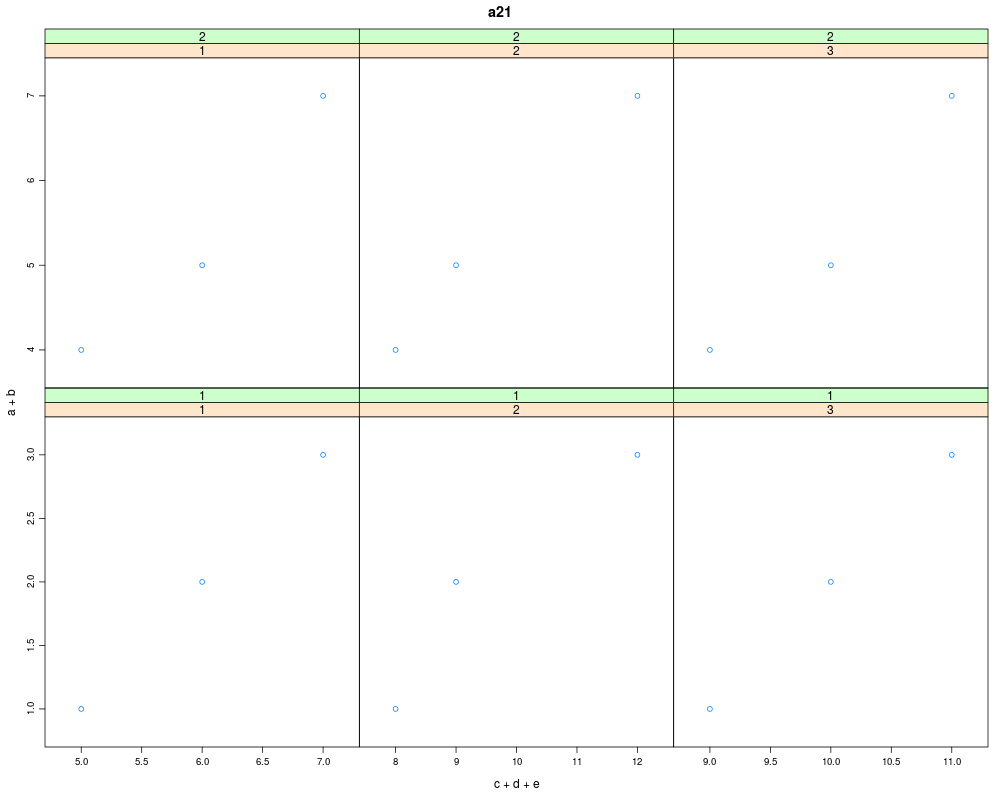
combineLimits(a21)
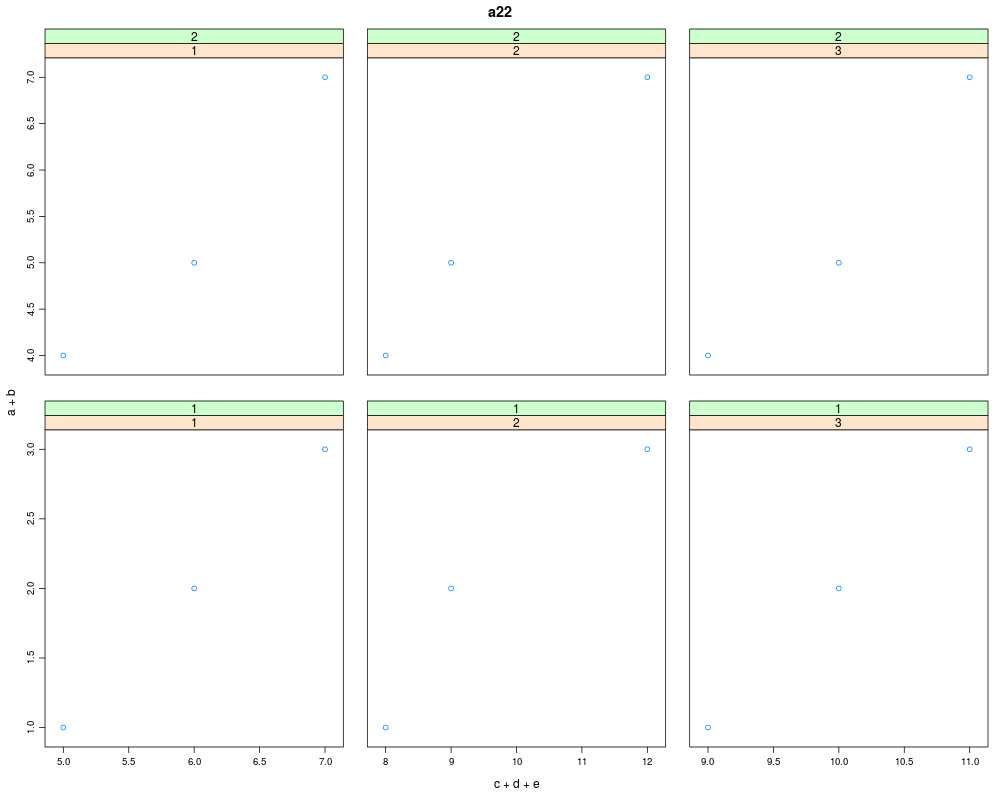
a22 <- update(a21, main="a22")
a22$x.scales$at <- list(FALSE, FALSE, FALSE, NULL, NULL, NULL)
a22$y.scales$at <- list(FALSE, NULL, NULL, FALSE, NULL, NULL)
a22
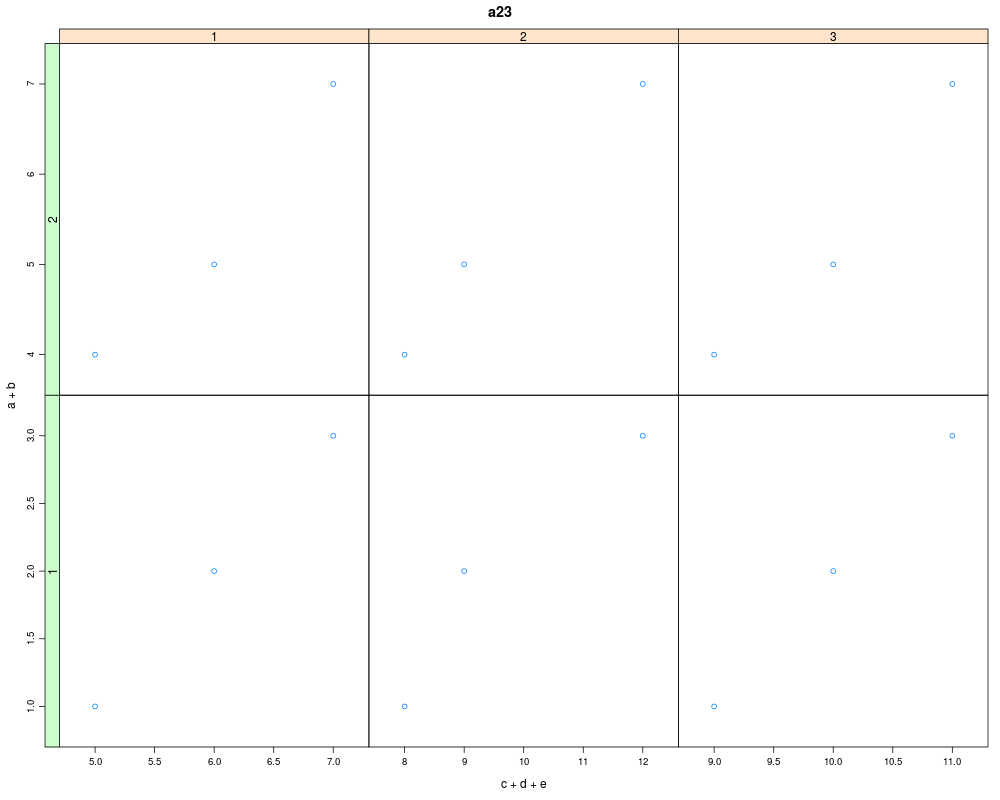
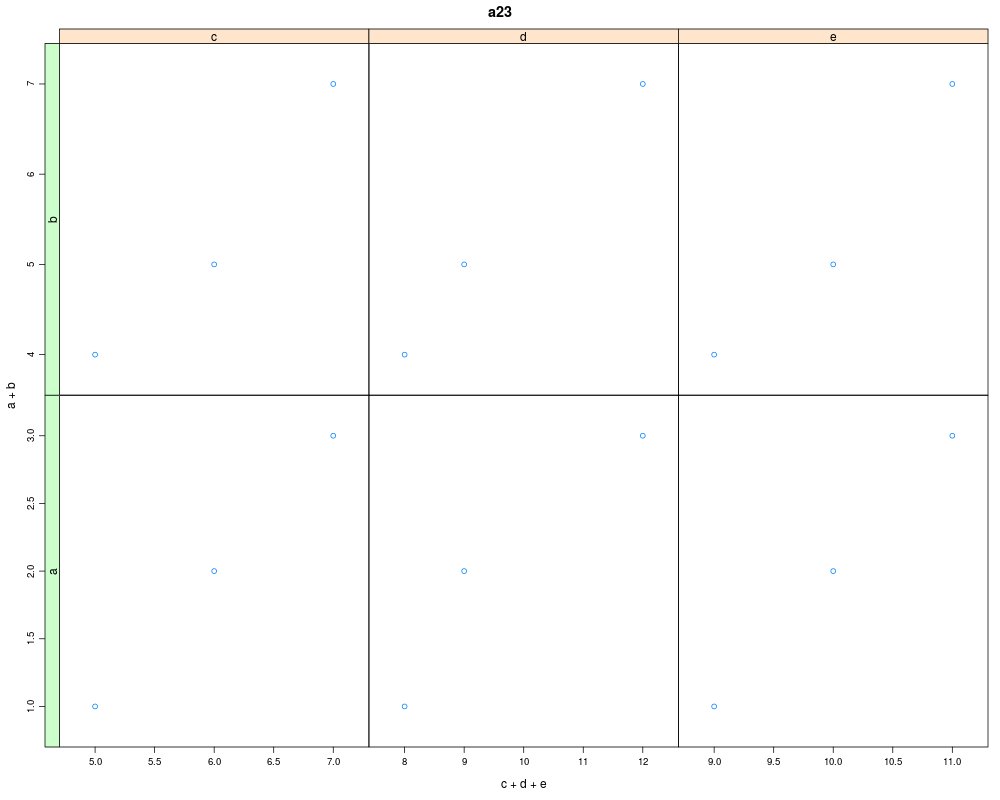
a23 <- useOuterStrips(combineLimits(a21))
a23 <- update(a23, main="a23")
a23
a23$condlevels
a23$condlevels <- list(letters[3:5], letters[1:2])
a23
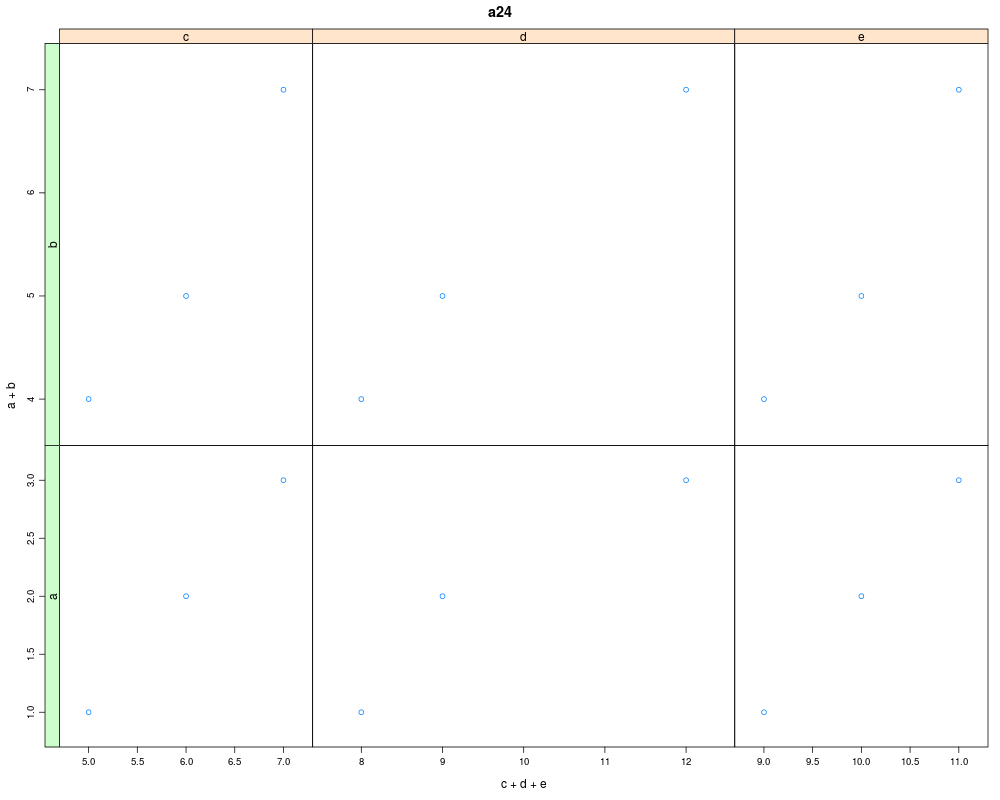
a24 <- resizePanels(update(a23, main="a24"), h=c(3,4), w=c(3,5,3))
a24
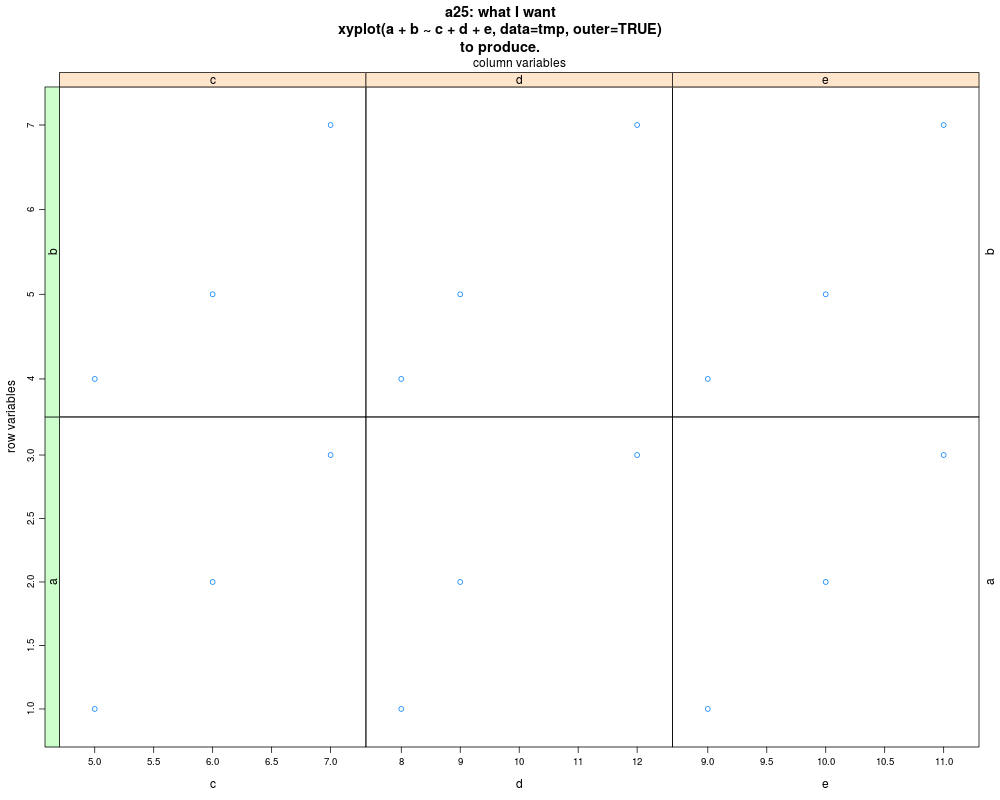
a25 <- update(a23, xlab=letters[3:5], ylab.right=letters[1:2],
xlab.top="column variables",
ylab="row variables",
scales=list(x=list(alternating=1), y=list(alternating=2)),
main="a25: what I want\nxyplot(a + b ~ c + d + e, data=tmp, outer=TRUE)\nto produce.")
a25
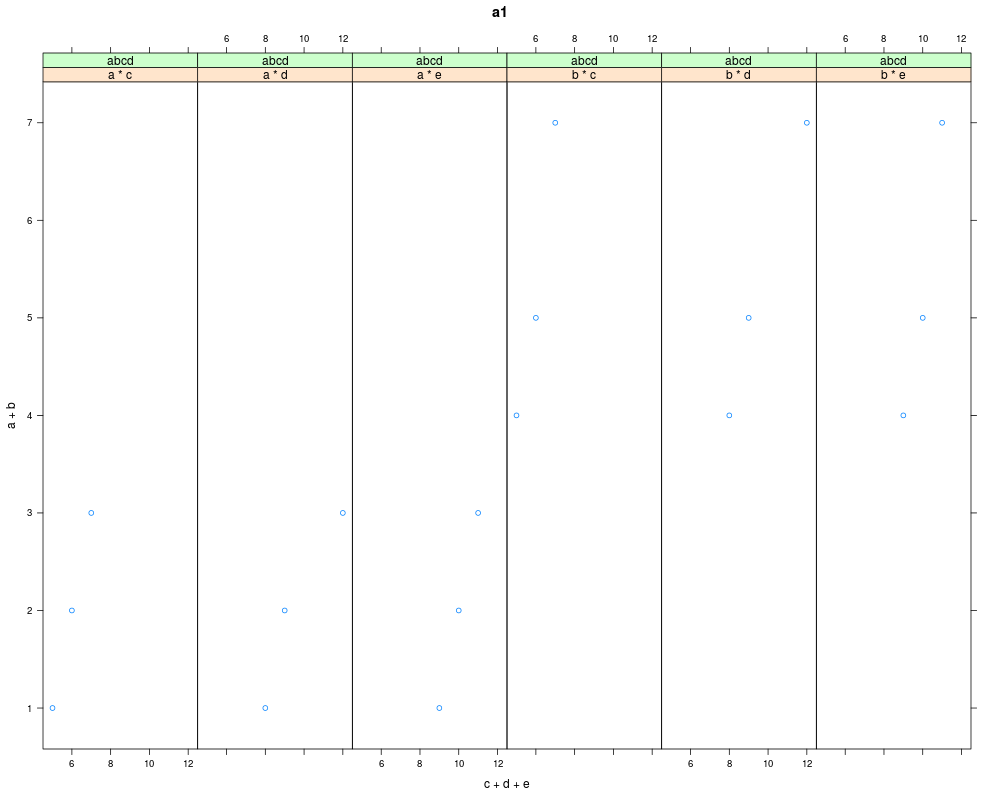
as.matrix(a1)
as.matrix(a1, yname="abcd")
as.matrix(a1, yname="abcd", row=TRUE)
Results
R version 3.3.1 (2016-06-21) -- "Bug in Your Hair"
Copyright (C) 2016 The R Foundation for Statistical Computing
Platform: x86_64-pc-linux-gnu (64-bit)

R is free software and comes with ABSOLUTELY NO WARRANTY.
You are welcome to redistribute it under certain conditions.
Type 'license()' or 'licence()' for distribution details.

R is a collaborative project with many contributors.
Type 'contributors()' for more information and
'citation()' on how to cite R or R packages in publications.

Type 'demo()' for some demos, 'help()' for on-line help, or
'help.start()' for an HTML browser interface to help.
Type 'q()' to quit R.

> library(HH)
Loading required package: lattice
Loading required package: grid
Loading required package: latticeExtra
Loading required package: RColorBrewer
Loading required package: multcomp
Loading required package: mvtnorm
Loading required package: survival
Loading required package: TH.data
Loading required package: MASS

Attaching package: 'TH.data'

The following object is masked from 'package:MASS':

    geyser

Loading required package: gridExtra
> png(filename="/home/ddbj/snapshot/RGM3/R_CC/result/HH/matrix.trellis.Rd_%03d_medium.png", width=480, height=480)
> ### Name: matrix.trellis
> ### Title: Convert a one-dimensional trellis object to a two-dimensional
> ###   trellis object. This permits combineLimits and useOuterStrips to
> ###   work.
> ### Aliases: matrix.trellis as.matrix.trellis
> ### Keywords: dplot
>
> ### ** Examples
>
> tmp <- data.frame(a=1:3,
+                   b=c(4,5,7),
+                   c=5:7,
+                   d=c(8, 9, 12),
+                   e=9:11)
> tmp
  a b c  d  e
1 1 4 5  8  9
2 2 5 6  9 10
3 3 7 7 12 11
> a1 <- xyplot(a + b ~ c + d + e, data=tmp, outer=TRUE,
+              main="a1")
> a1
> dim(a1)
[1] 6
> a2 <- xyplot(a + b ~ c + d + e, data=tmp, outer=TRUE,
+              scales=list(relation="free"), main="a2")
> a2
> dim(a2)
[1] 6
> try(combineLimits(a2))
Error in structure(list(c(4.86, 7.14), c(7.72, 12.28), c(8.86, 11.14),  :
  incorrect number of dimensions
In addition: Warning message:
In combineLimits(a2) :
  Only one conditioning variable; nothing interesting will happen.
> combineLimits.trellisvector(a2)
> combineLimits.trellisvector(update(a2, layout=c(3,2)))
>
> a21 <- matrix.trellis(a2, ncol=3, nrow=2, byrow=TRUE)
> a21 <- update(a21, main="a21")
> a21
> dim(a21)
[1] 3 2
> a21$x.scales$at
[1] FALSE
> combineLimits(a21)
>
> a22 <- update(a21, main="a22")
> a22$x.scales$at <- list(FALSE, FALSE, FALSE, NULL, NULL, NULL)
> a22$y.scales$at <- list(FALSE, NULL, NULL, FALSE, NULL, NULL)
> a22
>
> a23 <- useOuterStrips(combineLimits(a21))
> a23 <- update(a23, main="a23")
> a23
> a23$condlevels
[[1]]
[1] 1 2 3

[[2]]
[1] 1 2

> a23$condlevels <- list(letters[3:5], letters[1:2])
> a23
>
> a24 <- resizePanels(update(a23, main="a24"), h=c(3,4), w=c(3,5,3))
> a24
>
> a25 <- update(a23, xlab=letters[3:5], ylab.right=letters[1:2],
+               xlab.top="column variables",
+               ylab="row variables",
+               scales=list(x=list(alternating=1), y=list(alternating=2)),
+               main="a25: what I want\nxyplot(a + b ~ c + d + e, data=tmp, outer=TRUE)\nto produce.")
> a25
>
> as.matrix(a1)
> as.matrix(a1, yname="abcd")
> as.matrix(a1, yname="abcd", row=TRUE)
>
>
>
>
>
>
> dev.off()
null device
          1
>
|
Created & Maintained by Osamu Ogasawara (osamu.ogasawara@gmail.com) and 