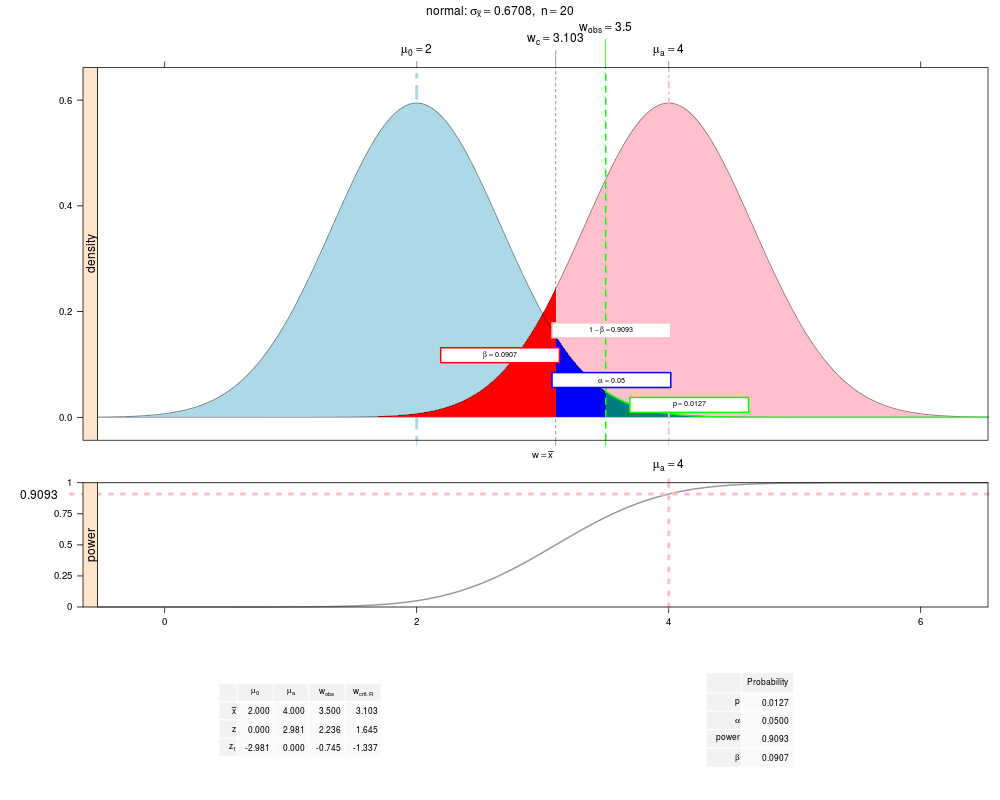
Construct a power graph based on the NTplot. The exported function
powerplot calls NormalAndTPower to construct a power curve or beta curve (operating
characteristic curve) (or both) from its argument and catenates it to the original
graph. The unexported function NormalAndTPower does the
construction.
digits.top.axis is the number of significant digits for the top
axis. digits.left is the number of significant digits for
the observed power or beta on the left axis. digits is a
convenience argument to set both digits.axis and
digits.left at the same time. These number is passed to the
format function. cex.top.axis is the cex value
for the top axis values. cex.left.axis is the cex value for
the observed power or beta on the left axis.
col.power, col.beta
Colors used for the crosshairs on the power and beta
panels.
The default values are the colors used for the power and beta regions of the
NTplot panel.
lwd.reference, lwd.line
lwd values for the power or beta
panel.
lwd.line is used for the power curve or beta curve.
lwd.reference
is used for the crosshairs.
R version 3.3.1 (2016-06-21) -- "Bug in Your Hair"
Copyright (C) 2016 The R Foundation for Statistical Computing
Platform: x86_64-pc-linux-gnu (64-bit)

R is free software and comes with ABSOLUTELY NO WARRANTY.
You are welcome to redistribute it under certain conditions.
Type 'license()' or 'licence()' for distribution details.

R is a collaborative project with many contributors.
Type 'contributors()' for more information and
'citation()' on how to cite R or R packages in publications.

Type 'demo()' for some demos, 'help()' for on-line help, or
'help.start()' for an HTML browser interface to help.
Type 'q()' to quit R.

> library(HH)
Loading required package: lattice
Loading required package: grid
Loading required package: latticeExtra
Loading required package: RColorBrewer
Loading required package: multcomp
Loading required package: mvtnorm
Loading required package: survival
Loading required package: TH.data
Loading required package: MASS

Attaching package: 'TH.data'

The following object is masked from 'package:MASS':

    geyser

Loading required package: gridExtra
> png(filename="/home/ddbj/snapshot/RGM3/R_CC/result/HH/normal.and.t.and.power.Rd_%03d_medium.png", width=480, height=480)
> ### Name: NormalAndTPower
> ### Title: Construct a power graph based on the NTplot.
> ### Aliases: NormalAndTPower powerplot powerplot.NormalAndTplot 'power
> ###   curve' 'beta curve' 'operating characteristic curve'
> ### Keywords: hplot
>
> ### ** Examples
>
>
> nt <- NTplot(mean0=2, mean1=4, sd=3, n=20, xlim=c(-.1, 6.1), xbar=3.5)
> powerplot(nt)
>
> ## Not run:
> ##D tt <- NTplot(mean0=2, mean1=4, sd=3, n=20, xlim=c(-.1, 6.1), xbar=3.5, df=4, distribution.name="t")
> ##D powerplot(tt)
> ##D
> ##D ntc <- NTplot(xbar=2, sd=3, n=20, xlim=c(-.1, 4.1), type="confidence",
> ##D               alpha.left=.025, alpha.right=.025)
> ##D ntc
> ##D try(powerplot(ntc))
> ## End(Not run)
>
>
>
>
>
> dev.off()
null device
          1
>
 .
.