Supported by Dr. Osamu Ogasawara and  . . |
|
Last data update: 2014.03.03 |
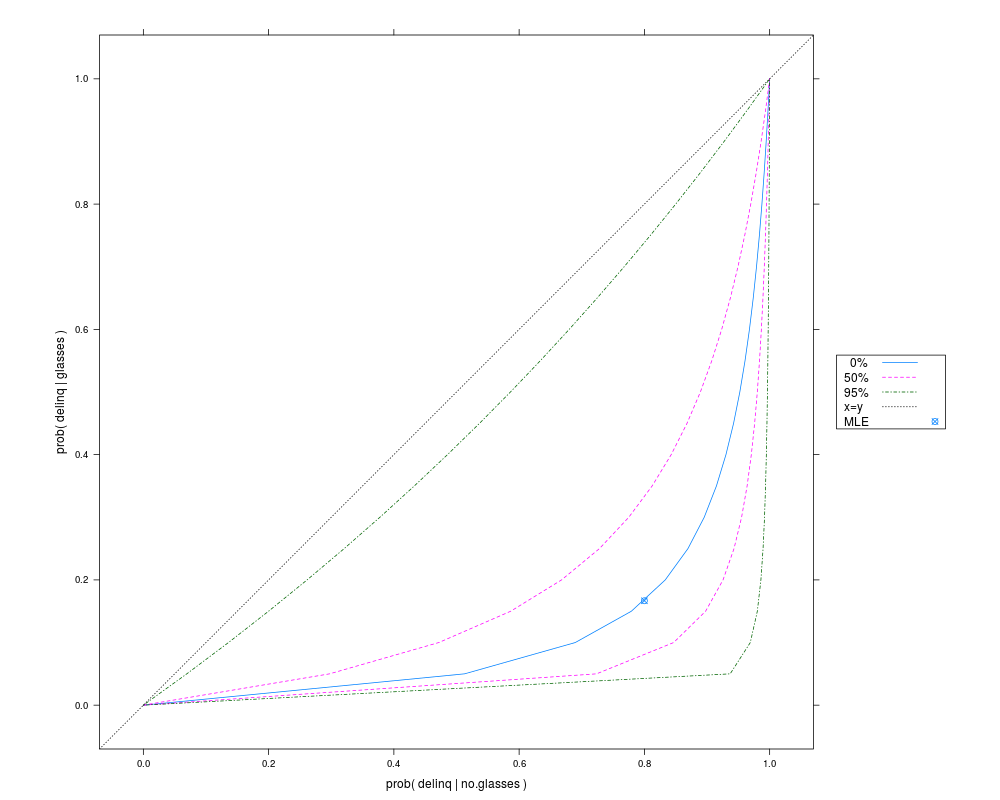
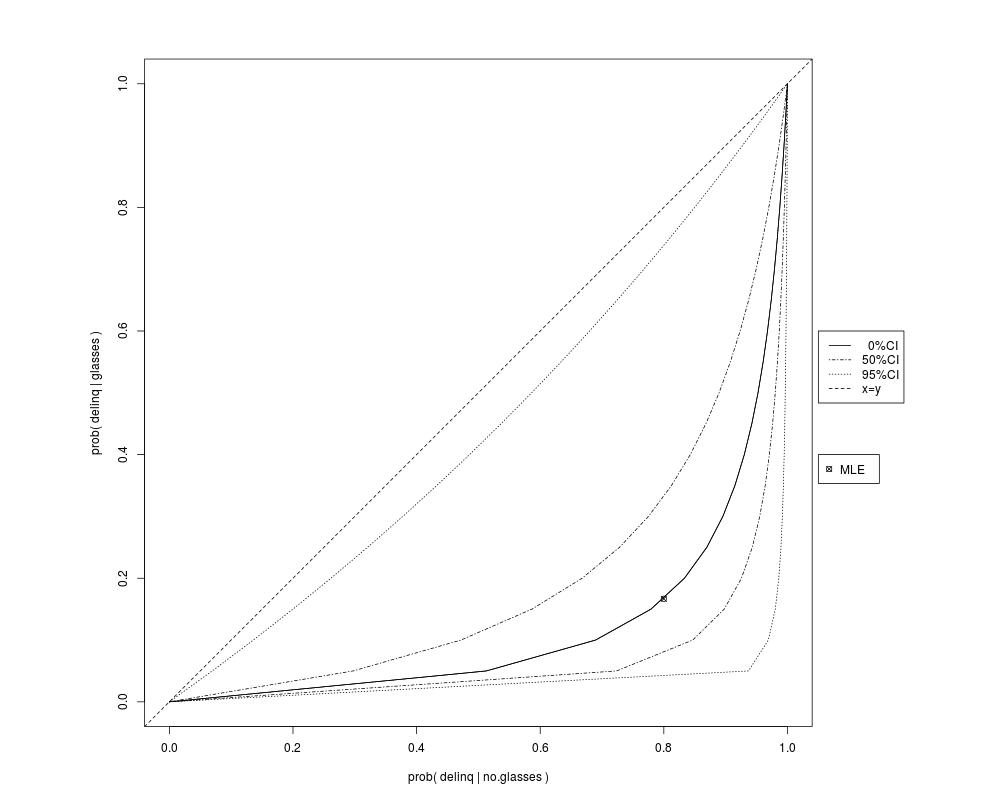
Calculate or plot the odds ratio for a 2x2 table of counts.DescriptionCalculate or plot the odds ratio for a 2x2 table of counts. The plot shows the confidence intervals on the probability of row2 for fixed odds ratio and specified probability for row1. Usage
OddsRatio(x, alpha = 0.05)

plotOddsRatio(x,
              ylab="prob(col1 | row1)",
              xlab="prob(col1 | row2)",
              alpha=c(.50, .05),
              col=trellis.par.get("superpose.line")$col,
              lwd=trellis.par.get("superpose.line")$lwd,
              lwd.reference=1,
              ...)

plotOddsRatio.base(x,
 ylab = "prob(col1 | row1)", xlab = "prob(col1 | row2)",
 alpha = c(0.05, 0.5),
 legend.x=1.05,
 oma=c(0,0,0,5), ...)
Arguments
Value
The older
Author(s)Richard M. Heiberger <rmh@temple.edu> ReferencesHeiberger, Richard M. and Holland, Burt (2004b). Statistical Analysis and Data Display: An Intermediate Course with Examples in S-Plus, R, and SAS. Springer Texts in Statistics. Springer. ISBN 0-387-40270-5. Examplesdata(glasses) ## draw the iso-odds ratio plot with 50% CI and 95% CI, plotOddsRatio(glasses) ## return the 95% CI information OddsRatio(glasses) ## draw the iso-odds ratio plot with 50% CI and 95% CI, ## invisibly return the 95% CI information plotOddsRatio.base(glasses) Results
R version 3.3.1 (2016-06-21) -- "Bug in Your Hair"
Copyright (C) 2016 The R Foundation for Statistical Computing
Platform: x86_64-pc-linux-gnu (64-bit)

R is free software and comes with ABSOLUTELY NO WARRANTY.
You are welcome to redistribute it under certain conditions.
Type 'license()' or 'licence()' for distribution details.

R is a collaborative project with many contributors.
Type 'contributors()' for more information and
'citation()' on how to cite R or R packages in publications.

Type 'demo()' for some demos, 'help()' for on-line help, or
'help.start()' for an HTML browser interface to help.
Type 'q()' to quit R.

> library(HH)
Loading required package: lattice
Loading required package: grid
Loading required package: latticeExtra
Loading required package: RColorBrewer
Loading required package: multcomp
Loading required package: mvtnorm
Loading required package: survival
Loading required package: TH.data
Loading required package: MASS

Attaching package: 'TH.data'

The following object is masked from 'package:MASS':

    geyser

Loading required package: gridExtra
> png(filename="/home/ddbj/snapshot/RGM3/R_CC/result/HH/odds.ratio.Rd_%03d_medium.png", width=480, height=480)
> ### Name: OddsRatio
> ### Title: Calculate or plot the odds ratio for a 2x2 table of counts.
> ### Aliases: OddsRatio plotOddsRatio plotOddsRatio.base
> ### Keywords: hplot htest
>
> ### ** Examples
>
> data(glasses)
>
> ## draw the iso-odds ratio plot with 50% CI and 95% CI,
> plotOddsRatio(glasses)
>
> ## return the 95% CI information
> OddsRatio(glasses)
$p1
[1] 0.1666667

$p2
[1] 0.8

$omega1
[1] 0.2

$omega2
[1] 4

$psihat
[1] 20

$s.ln.psihat
[1] 1.350926

$ci.ln.psihat
[1] 0.3479667 5.6434978

$ci.psihat
[1]   1.416185 282.448946

$prob1
 [1] 0.00 0.05 0.10 0.15 0.20 0.25 0.30 0.35 0.40 0.45 0.50 0.55 0.60 0.65 0.70
[16] 0.75 0.80 0.85 0.90 0.95 1.00

$odds1
 [1]  0.00000000  0.05263158  0.11111111  0.17647059  0.25000000  0.33333333
 [7]  0.42857143  0.53846154  0.66666667  0.81818182  1.00000000  1.22222222
[13]  1.50000000  1.85714286  2.33333333  3.00000000  4.00000000  5.66666667
[19]  9.00000000 19.00000000         Inf

$odds2
 [1]   0.000000   1.052632   2.222222   3.529412   5.000000   6.666667
 [7]   8.571429  10.769231  13.333333  16.363636  20.000000  24.444444
[13]  30.000000  37.142857  46.666667  60.000000  80.000000 113.333333
[19] 180.000000 380.000000        Inf

$ci.odds2
             [,1]       [,2]
 [1,]  0.00000000    0.00000
 [2,]  0.07453606   14.86573
 [3,]  0.15735390   31.38322
 [4,]  0.24991502   49.84393
 [5,]  0.35404628   70.61224
 [6,]  0.47206171   94.14965
 [7,]  0.60693649  121.04955
 [8,]  0.76256123  152.08789
 [9,]  0.94412343  188.29930
[10,]  1.15869693  231.09459
[11,]  1.41618514  282.44895
[12,]  1.73089295  345.21538
[13,]  2.12427771  423.67342
[14,]  2.63005812  524.54804
[15,]  3.30443199  659.04754
[16,]  4.24855542  847.34684
[17,]  5.66474056 1129.79578
[18,]  8.02504912 1600.54403
[19,] 12.74566625 2542.04051
[20,] 26.90751765 5366.52997
[21,]         Inf        Inf

$prob2
 [1] 0.0000000 0.5128205 0.6896552 0.7792208 0.8333333 0.8695652 0.8955224
 [8] 0.9150327 0.9302326 0.9424084 0.9523810 0.9606987 0.9677419 0.9737828
[15] 0.9790210 0.9836066 0.9876543 0.9912536 0.9944751 0.9973753 1.0000000

$ci.prob2
            [,1]      [,2]
 [1,] 0.00000000 0.0000000
 [2,] 0.06936581 0.9369711
 [3,] 0.13596006 0.9691198
 [4,] 0.19994561 0.9803320
 [5,] 0.26147281 0.9860359
 [6,] 0.32068065 0.9894902
 [7,] 0.37769787 0.9918066
 [8,] 0.43264382 0.9934678
 [9,] 0.48562937 0.9947174
[10,] 0.53675758 0.9956914
[11,] 0.58612443 0.9964720
[12,] 0.63381941 0.9971116
[13,] 0.67992602 0.9976452
[14,] 0.72452232 0.9980972
[15,] 0.76768131 0.9984850
[16,] 0.80947138 0.9988212
[17,] 0.84995665 0.9991157
[18,] 0.88919728 0.9993756
[19,] 0.92724980 0.9996068
[20,] 0.96416736 0.9998137
[21,] 1.00000000 1.0000000

>
> ## draw the iso-odds ratio plot with 50% CI and 95% CI,
> ## invisibly return the 95% CI information
> plotOddsRatio.base(glasses)
>
>
>
>
>
> dev.off()
null device
          1
>
|