Last data update: 2014.03.03
R: trellis panel function, with labeled rows and columns and...
panel.cartesian R Documentation
trellis panel function, with labeled rows and columns and without
strip labels.
Description
trellis panel function, with labeled rows and columns and without
strip labels. Designed for use with the ladder of powers plot.
Usage
panel.cartesian(x, y,
                x.label=unique(panel.labels[,"x"]),
                y.label=unique(panel.labels[,"y"]),
                group.label.side="",
                axis3.line=1,
                xg.label, yg.label, g.cex=.7,
                rescale=list(x=TRUE,y=TRUE), ...,
                browser.on=FALSE)
Arguments
x, y
x and y as for any other panel function
x.label
labels for the columns of the scatterplot matrix
y.label
labels for the rows of the scatterplot matrix
axis3.line
The x.label doesn't always show up in the
right place. This allows the user to adjust it's position.
group.label.side
c("","left","top"), when the plotting
formula is conditioned on a group factor, the levels of the group are
displayed in the margins of the plot. The appearance depends on the
setting of the trellis between argument. Getting it to look good
for any given plot requires experimentation. Since it is redundant with
the information in the strip labels, leaving it at the default ""
is often the best thing to do.
xg.label
group labels for rows of the scatterplot matrix
yg.label
group labels for rows of the scatterplot matrix
g.cex
cex for the group labels
rescale
alternate way to get something similar to relation="free"
...
other arguments
browser.on
logical, normally FALSE. This is a debugging
tool. When TRUE, the browser() is turned on at various
critical points.
References
Heiberger, Richard M. and Holland, Burt (2004b).
Statistical Analysis and Data Display: An Intermediate Course
with Examples in S-Plus, R, and SAS .
Springer Texts in Statistics. Springer.
ISBN 0-387-40270-5.
See Also
ladder, xysplom
Examples
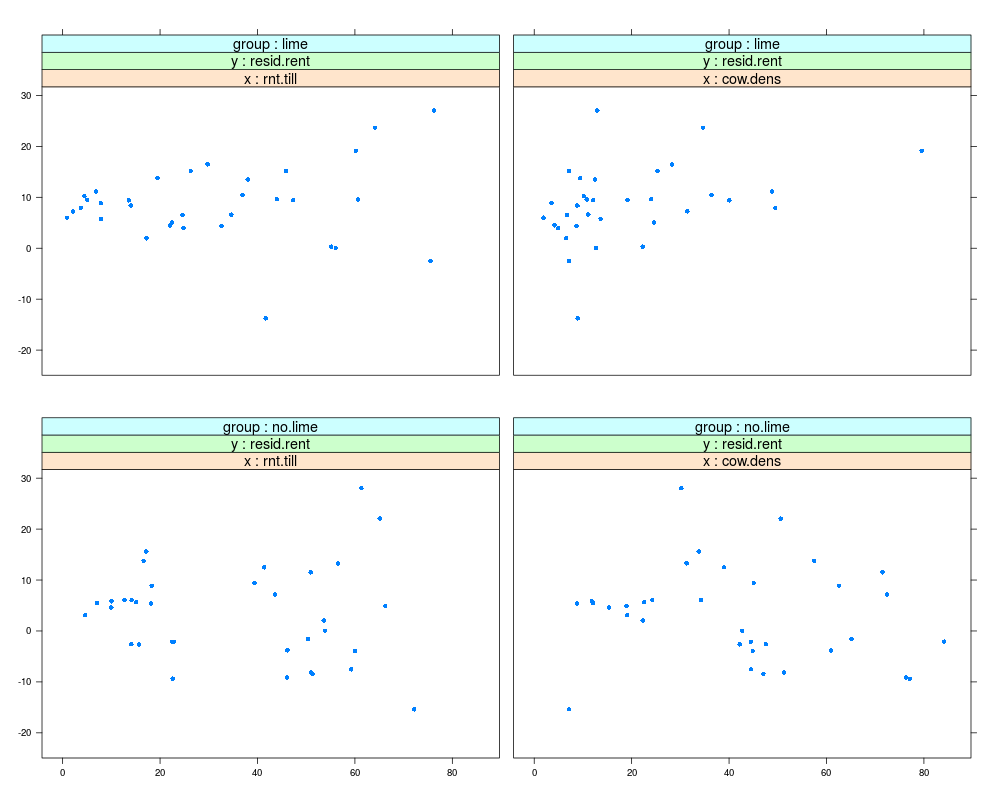
data(rent) ## Weisberg's file alr162
rent.lm <- lm(rnt.alf ~ rnt.till + cow.dens + lime, data=rent)
rent$resid.rent <- resid(rent.lm)
xysplom(resid.rent ~ rnt.till + cow.dens | lime, data=rent,
layout=c(2,2))
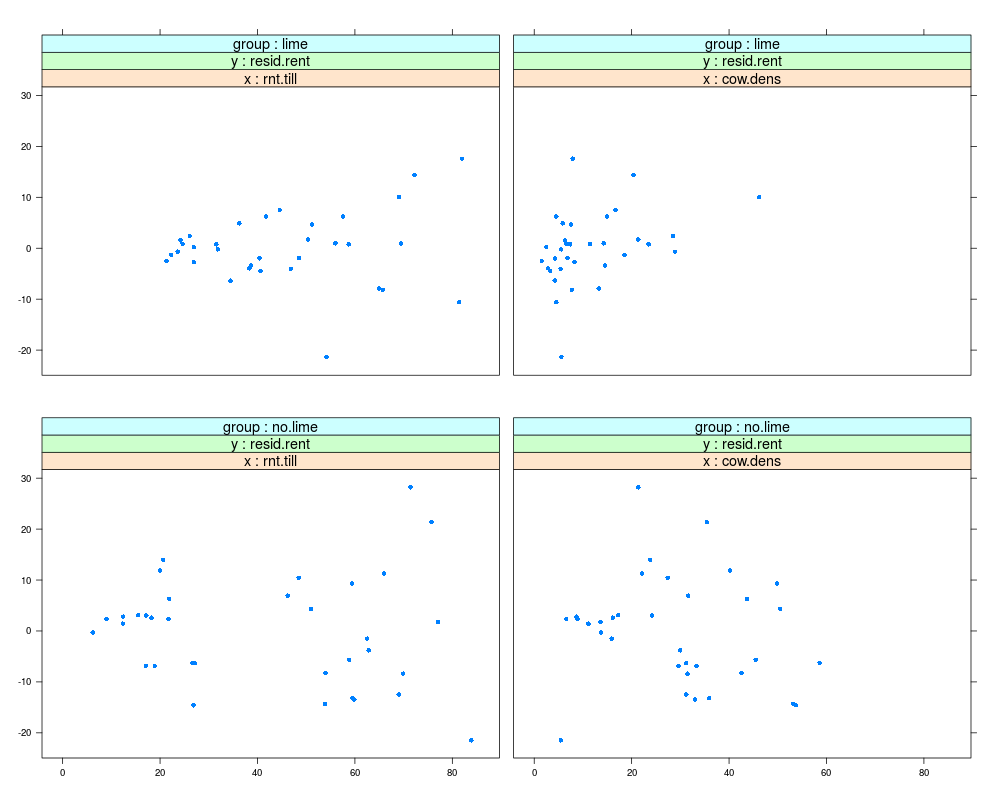
xysplom(resid.rent ~ rnt.till + cow.dens | lime, data=rent,
layout=c(2,2),
xlab="", ylab="",
x.label="", y.label="",
group.label.side="",
par.strip.text=list(cex=1.2),
panel=panel.cartesian,
axis3.line=2.4,
scales=list(
relation="same",
alternating=FALSE, labels=FALSE, ticks=FALSE),
between=list(x=1, y=3))
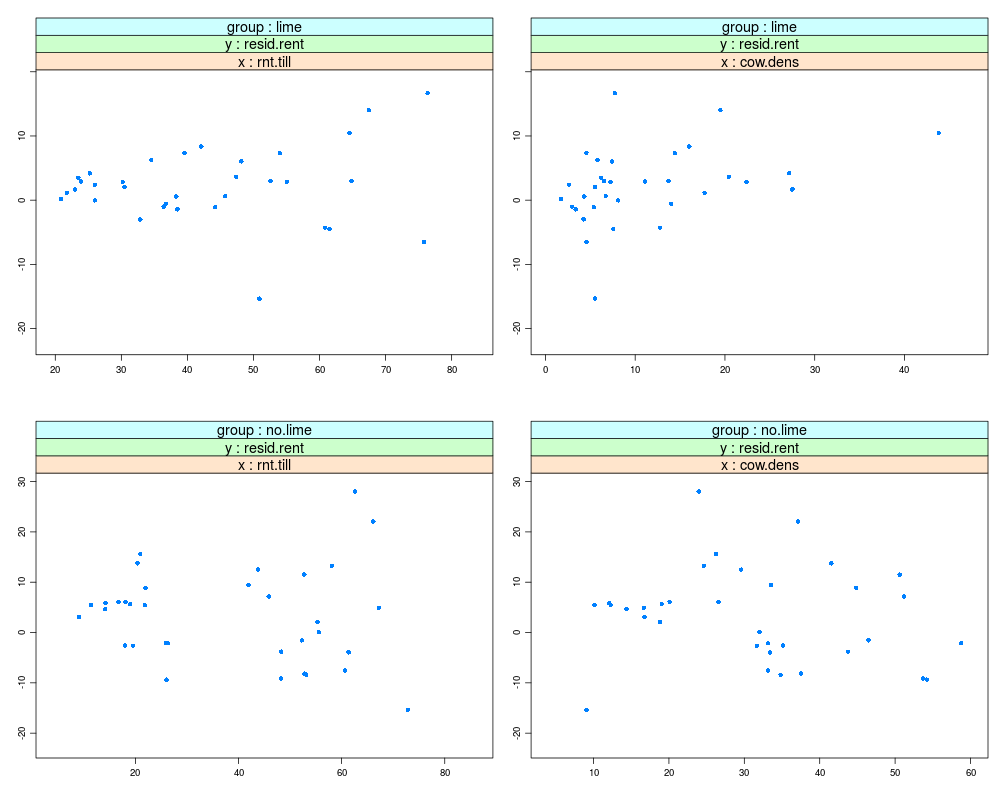
xysplom(resid.rent ~ rnt.till + cow.dens | lime, data=rent,
layout=c(2,2),
xlab="", ylab="",
x.label="", y.label="",
group.label.side="",
par.strip.text=list(cex=1.2),
panel=panel.cartesian,
axis3.line=3.6,
scales=list(
relation="same",
alternating=FALSE, labels=FALSE, ticks=FALSE),
rescale=list(x=FALSE, y=FALSE),
between=list(x=1, y=3))
xysplom(resid.rent ~ rnt.till + cow.dens | lime, data=rent,
layout=c(2,2),
xlab="", ylab="",
x.label="", y.label="",
group.label.side="",
par.strip.text=list(cex=1.2),
panel=panel.cartesian,
axis3.line=3.6,
scales=list(
relation="free",
alternating=FALSE, labels=FALSE, ticks=FALSE),
between=list(x=1, y=3))
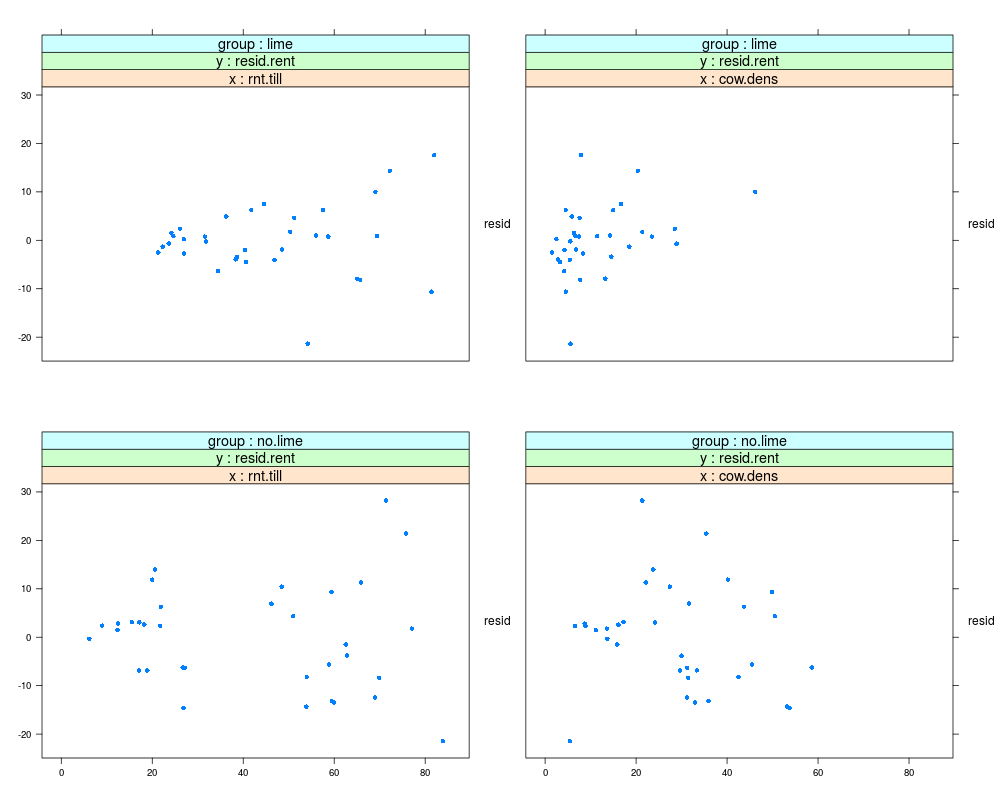
tmp <-
xysplom(resid.rent ~ rnt.till + cow.dens | lime, data=rent,
layout=c(2,2),
xlab="", ylab="",
y.label="resid",
group.label.side="top",
par.strip.text=list(cex=1.2),
panel=panel.cartesian,
axis3.line=3.6,
scales=list(alternating=FALSE, labels=FALSE, ticks=FALSE),
rescale=list(x=FALSE, y=FALSE),
between=list(x=4, y=5))
if.R(r=tmp$par.settings <- list(layout.widths=list(right.padding=4)),
s={})
tmp
Results
R version 3.3.1 (2016-06-21) -- "Bug in Your Hair"
Copyright (C) 2016 The R Foundation for Statistical Computing
Platform: x86_64-pc-linux-gnu (64-bit)

R is free software and comes with ABSOLUTELY NO WARRANTY.
You are welcome to redistribute it under certain conditions.
Type 'license()' or 'licence()' for distribution details.

R is a collaborative project with many contributors.
Type 'contributors()' for more information and
'citation()' on how to cite R or R packages in publications.

Type 'demo()' for some demos, 'help()' for on-line help, or
'help.start()' for an HTML browser interface to help.
Type 'q()' to quit R.

> library(HH)
Loading required package: lattice
Loading required package: grid
Loading required package: latticeExtra
Loading required package: RColorBrewer
Loading required package: multcomp
Loading required package: mvtnorm
Loading required package: survival
Loading required package: TH.data
Loading required package: MASS

Attaching package: 'TH.data'

The following object is masked from 'package:MASS':

    geyser

Loading required package: gridExtra
> png(filename="/home/ddbj/snapshot/RGM3/R_CC/result/HH/panel.cartesian.Rd_%03d_medium.png", width=480, height=480)
> ### Name: panel.cartesian
> ### Title: trellis panel function, with labeled rows and columns and
> ###   without strip labels.
> ### Aliases: panel.cartesian
> ### Keywords: hplot
>
> ### ** Examples
>
> data(rent)  ## Weisberg's file alr162
>
> rent.lm <- lm(rnt.alf ~ rnt.till + cow.dens + lime, data=rent)
> rent$resid.rent <- resid(rent.lm)
>
> xysplom(resid.rent ~ rnt.till + cow.dens | lime, data=rent,
+         layout=c(2,2))
>
> xysplom(resid.rent ~ rnt.till + cow.dens | lime, data=rent,
+         layout=c(2,2),
+         xlab="", ylab="",
+         x.label="", y.label="",
+         group.label.side="",
+         par.strip.text=list(cex=1.2),
+         panel=panel.cartesian,
+         axis3.line=2.4,
+         scales=list(
+           relation="same",
+           alternating=FALSE, labels=FALSE, ticks=FALSE),
+         between=list(x=1, y=3))
>
> xysplom(resid.rent ~ rnt.till + cow.dens | lime, data=rent,
+         layout=c(2,2),
+         xlab="", ylab="",
+         x.label="", y.label="",
+         group.label.side="",
+         par.strip.text=list(cex=1.2),
+         panel=panel.cartesian,
+         axis3.line=3.6,
+         scales=list(
+           relation="same",
+           alternating=FALSE, labels=FALSE, ticks=FALSE),
+         rescale=list(x=FALSE, y=FALSE),
+         between=list(x=1, y=3))
>
> xysplom(resid.rent ~ rnt.till + cow.dens | lime, data=rent,
+         layout=c(2,2),
+         xlab="", ylab="",
+         x.label="", y.label="",
+         group.label.side="",
+         par.strip.text=list(cex=1.2),
+         panel=panel.cartesian,
+         axis3.line=3.6,
+         scales=list(
+           relation="free",
+           alternating=FALSE, labels=FALSE, ticks=FALSE),
+         between=list(x=1, y=3))
>
> tmp <-
+ xysplom(resid.rent ~ rnt.till + cow.dens | lime, data=rent,
+         layout=c(2,2),
+         xlab="", ylab="",
+         y.label="resid",
+         group.label.side="top",
+         par.strip.text=list(cex=1.2),
+         panel=panel.cartesian,
+         axis3.line=3.6,
+         scales=list(alternating=FALSE, labels=FALSE, ticks=FALSE),
+         rescale=list(x=FALSE, y=FALSE),
+         between=list(x=4, y=5))
> if.R(r=tmp$par.settings <- list(layout.widths=list(right.padding=4)),
+      s={})
> tmp
>
>
>
>
>
>
> dev.off()
null device
          1
>
 .
.