Supported by Dr. Osamu Ogasawara and  . . |
|
Last data update: 2014.03.03 |
Dotplot with evenly spaced tiebreakers.DescriptionDotplot with evenly spaced tiebreakers. Multiple hits on a specific x value are stacked. Usage
panel.dotplot.tb(x, y, factor=.1,
                 jitter.data=TRUE, horizontal=TRUE,
                 max.freq=max(sapply(subsets, length)),
                 ...)
Arguments
DetailsCreates (possibly grouped) Dotplot of x against y. y is the ‘factor’. WarningIf the formula includes one or more conditioning factors, then the
user is responsible for providing a value for Author(s)Richard M. Heiberger Maintainer: Richard M. Heiberger <rmh@temple.edu> Examples
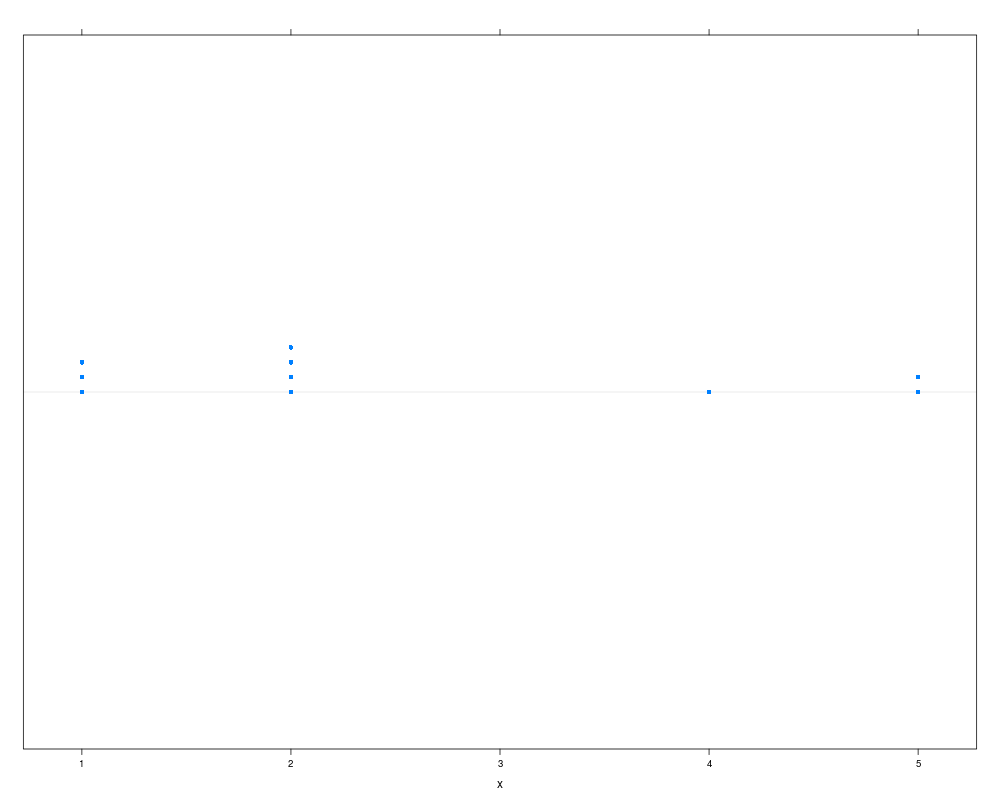
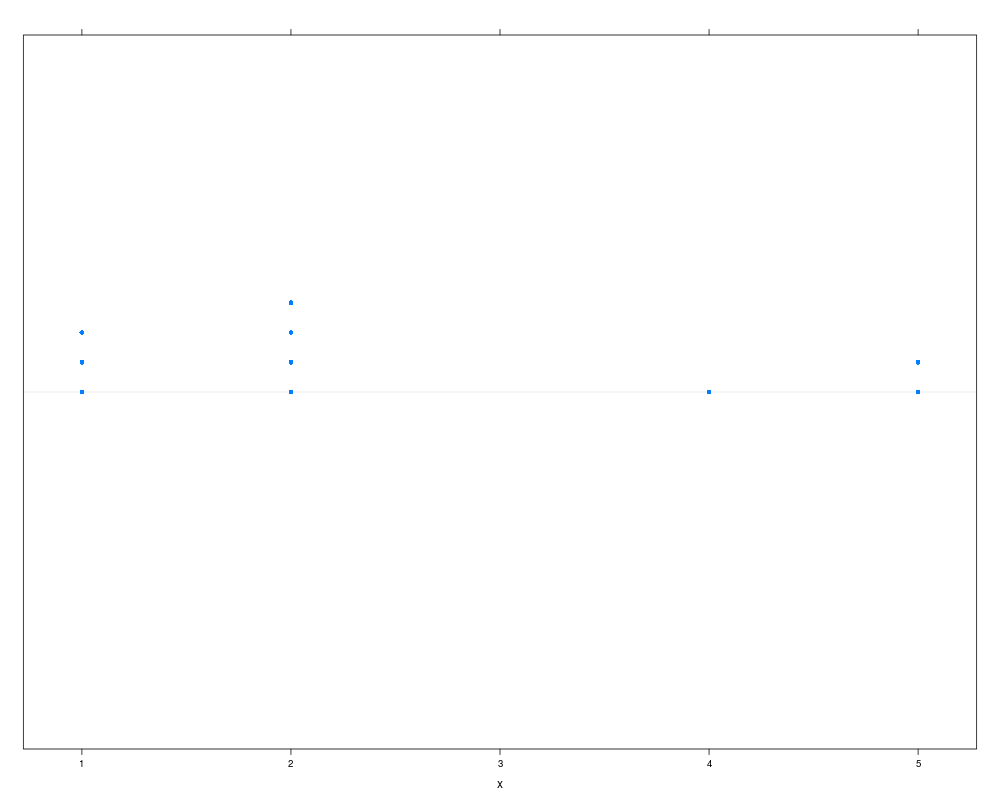
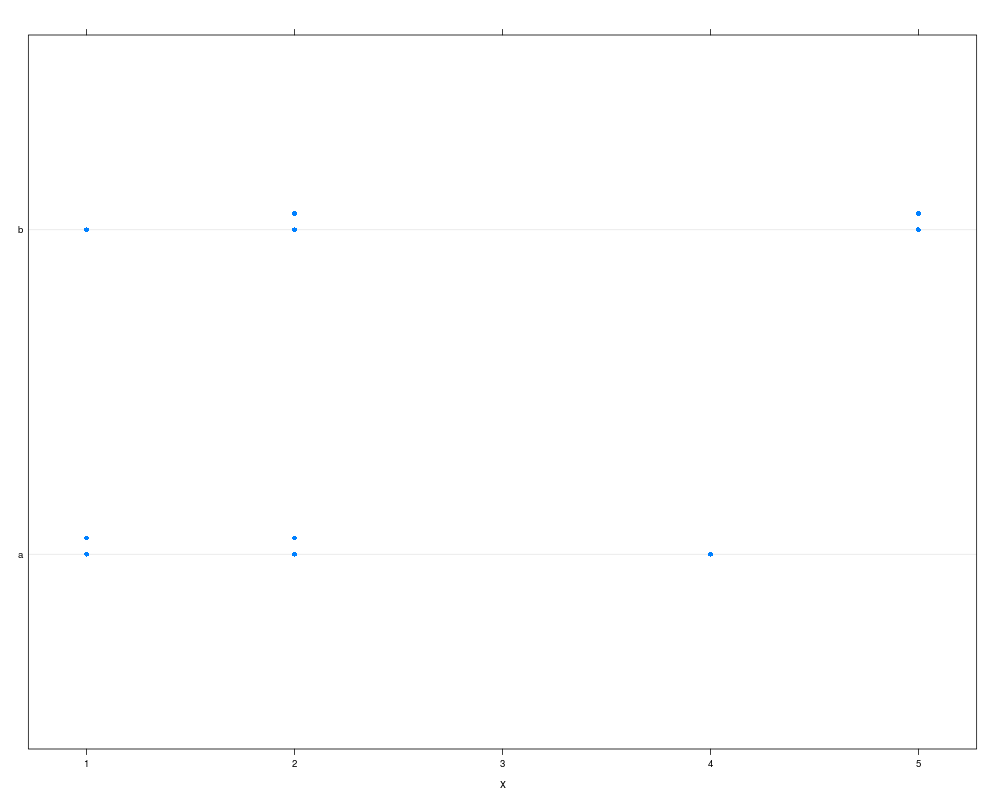
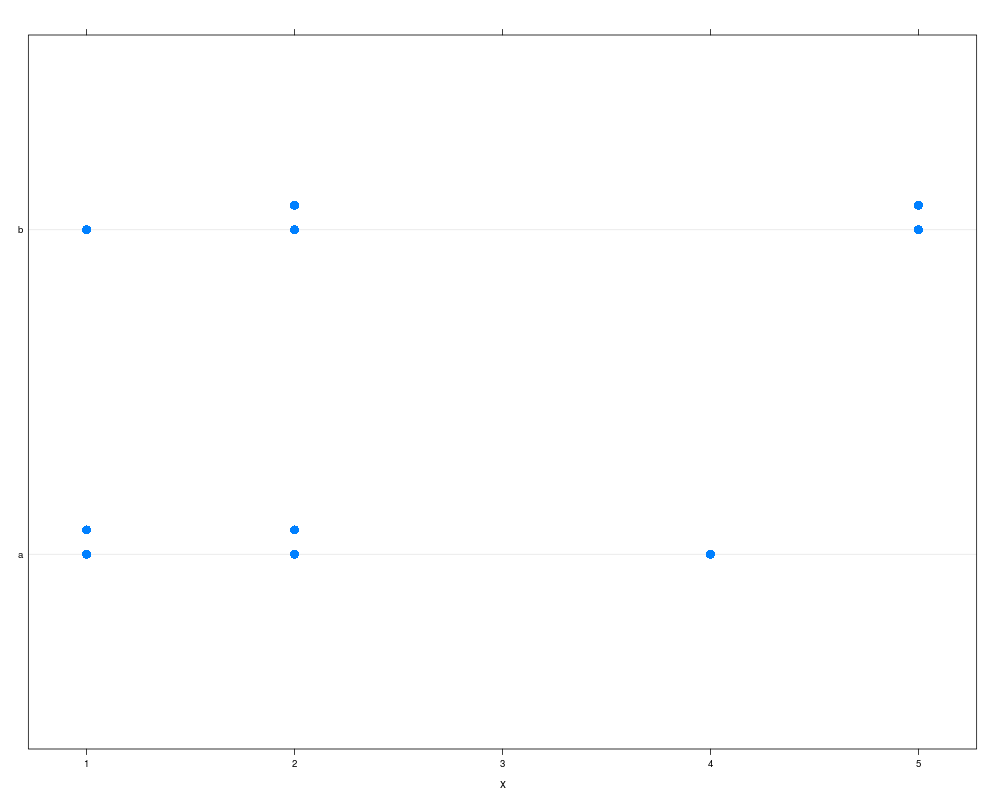
x <- c(1,1,2,2,2,5,4,2,1,5)
y <- factor(letters[rep(1:2, 5)])
dotplot(x, panel=panel.dotplot.tb)
dotplot(x, panel=panel.dotplot.tb, factor=.2)
dotplot(y ~ x, panel=panel.dotplot.tb)
dotplot(y ~ x, panel=panel.dotplot.tb, cex=1.5, factor=.15)
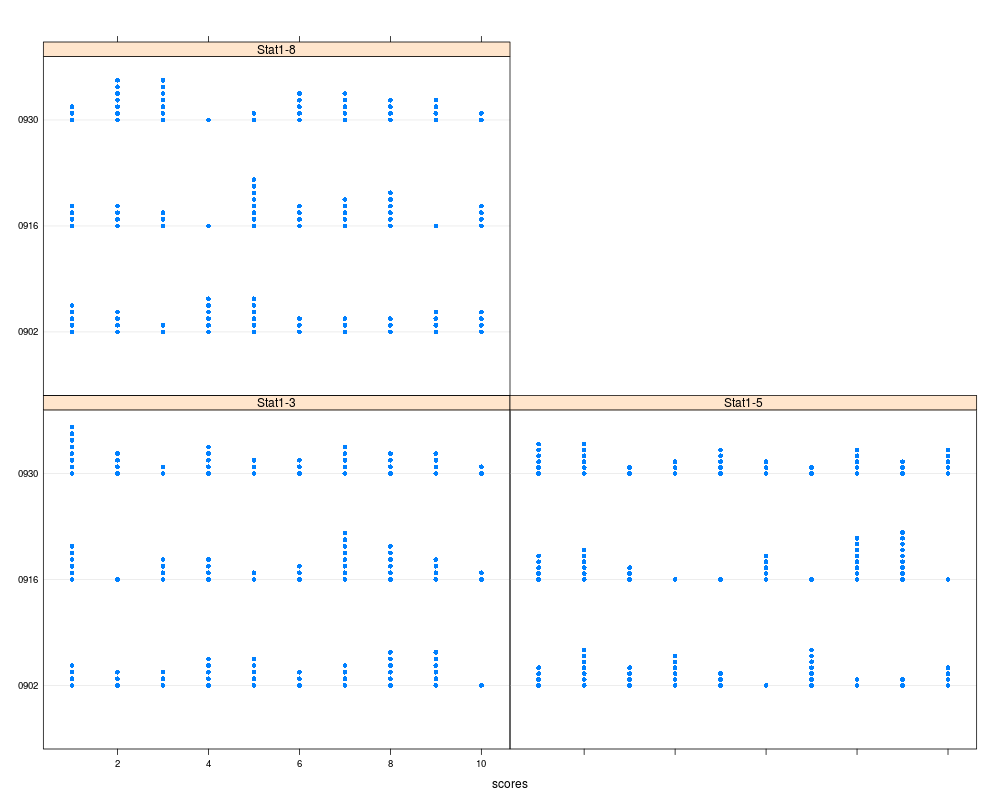
quiz <- data.frame(scores=sample(10, 360, replace=TRUE),
date=rep(rep(c("0902", "0916", "0930"), c(40,40,40)), 3),
section=rep(
c("Stat1-3", "Stat1-5", "Stat1-8"),
c(120,120,120)))
dotplot(date ~ scores | section, data=quiz,
panel=panel.dotplot.tb, factor=.5)
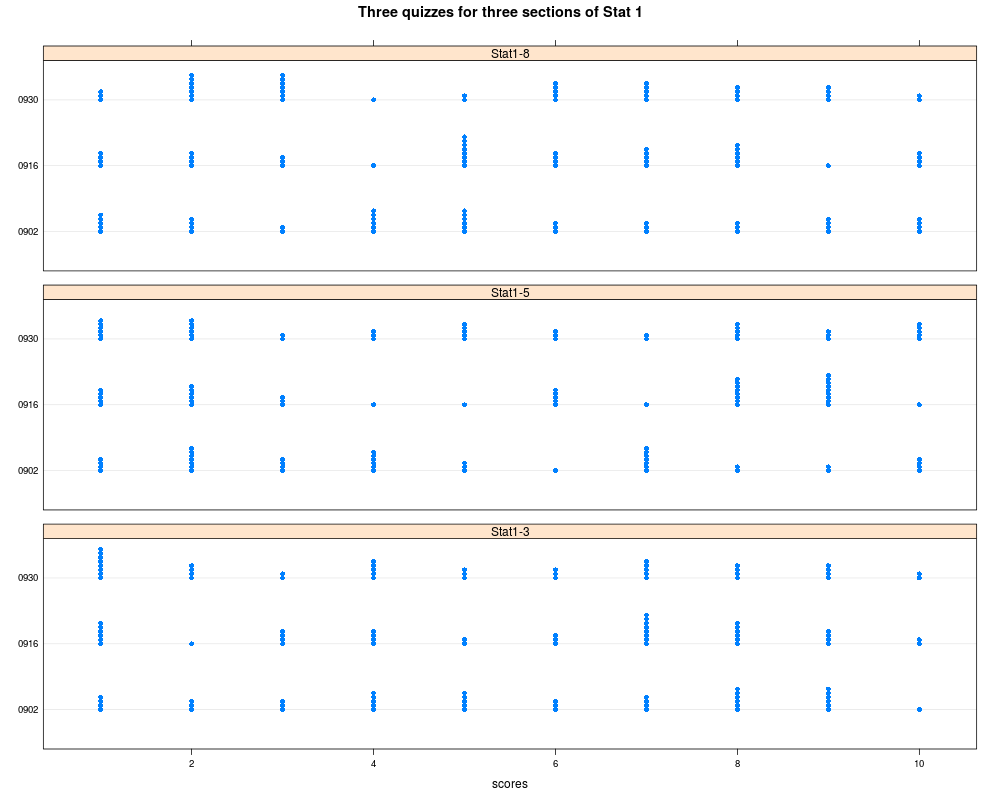
dotplot(date ~ scores | section, data=quiz,
panel=panel.dotplot.tb, factor=.5,
layout=c(1,3), between=list(y=1),
main='Three quizzes for three sections of Stat 1')
## If the formula includes one or more conditioning factors, then the
## user is responsible for providing a value for the argument max.freq
##
a <- rep(1, 10)
z <- c(1,1,2,2,2,3,2,3,1,1)
g <- LETTERS[c(1,1,1,1,1,2,2,2,2,2)]
print(split=c(1,1,2,1), more=TRUE,
dotplot( a ~ z | g, panel=panel.dotplot.tb,
factor=.6, cex=1.5, layout=c(2,1),
main="different scaling in each panel")
)
print(split=c(2,1,2,1), more=FALSE,
dotplot( a ~ z | g, panel=panel.dotplot.tb, max.freq=3,
factor=.6, cex=1.5, layout=c(2,1),
main="same scaling in each panel")
)
Results
R version 3.3.1 (2016-06-21) -- "Bug in Your Hair"
Copyright (C) 2016 The R Foundation for Statistical Computing
Platform: x86_64-pc-linux-gnu (64-bit)

R is free software and comes with ABSOLUTELY NO WARRANTY.
You are welcome to redistribute it under certain conditions.
Type 'license()' or 'licence()' for distribution details.

R is a collaborative project with many contributors.
Type 'contributors()' for more information and
'citation()' on how to cite R or R packages in publications.

Type 'demo()' for some demos, 'help()' for on-line help, or
'help.start()' for an HTML browser interface to help.
Type 'q()' to quit R.

> library(HH)
Loading required package: lattice
Loading required package: grid
Loading required package: latticeExtra
Loading required package: RColorBrewer
Loading required package: multcomp
Loading required package: mvtnorm
Loading required package: survival
Loading required package: TH.data
Loading required package: MASS

Attaching package: 'TH.data'

The following object is masked from 'package:MASS':

    geyser

Loading required package: gridExtra
> png(filename="/home/ddbj/snapshot/RGM3/R_CC/result/HH/panel.dotplot.tb.Rd_%03d_medium.png", width=480, height=480)
> ### Name: panel.dotplot.tb
> ### Title: Dotplot with evenly spaced tiebreakers.
> ### Aliases: panel.dotplot.tb
> ### Keywords: dplot
>
> ### ** Examples
>
> x <- c(1,1,2,2,2,5,4,2,1,5)
> y <- factor(letters[rep(1:2, 5)])
>
> dotplot(x, panel=panel.dotplot.tb)
> dotplot(x, panel=panel.dotplot.tb, factor=.2)
> dotplot(y ~ x, panel=panel.dotplot.tb)
> dotplot(y ~ x, panel=panel.dotplot.tb, cex=1.5, factor=.15)
>
>
>
> quiz <- data.frame(scores=sample(10, 360, replace=TRUE),
+                    date=rep(rep(c("0902", "0916", "0930"), c(40,40,40)), 3),
+                    section=rep(
+                      c("Stat1-3", "Stat1-5", "Stat1-8"),
+                      c(120,120,120)))
>
> dotplot(date ~ scores | section, data=quiz,
+         panel=panel.dotplot.tb, factor=.5)
>
> dotplot(date ~ scores | section, data=quiz,
+         panel=panel.dotplot.tb, factor=.5,
+         layout=c(1,3), between=list(y=1),
+         main='Three quizzes for three sections of Stat 1')
>
>
> ## If the formula includes one or more conditioning factors, then the
> ## user is responsible for providing a value for the argument max.freq
> ##
> a <- rep(1, 10)
> z <- c(1,1,2,2,2,3,2,3,1,1)
> g <- LETTERS[c(1,1,1,1,1,2,2,2,2,2)]
>
> print(split=c(1,1,2,1), more=TRUE,
+ dotplot( a ~ z | g, panel=panel.dotplot.tb,
+         factor=.6, cex=1.5, layout=c(2,1),
+         main="different scaling in each panel")
+ )
>
> print(split=c(2,1,2,1), more=FALSE,
+ dotplot( a ~ z | g, panel=panel.dotplot.tb, max.freq=3,
+         factor=.6, cex=1.5, layout=c(2,1),
+         main="same scaling in each panel")
+ )
>
>
>
>
>
>
> dev.off()
null device
          1
>
|