Supported by Dr. Osamu Ogasawara and  . . |
|
Last data update: 2014.03.03 |
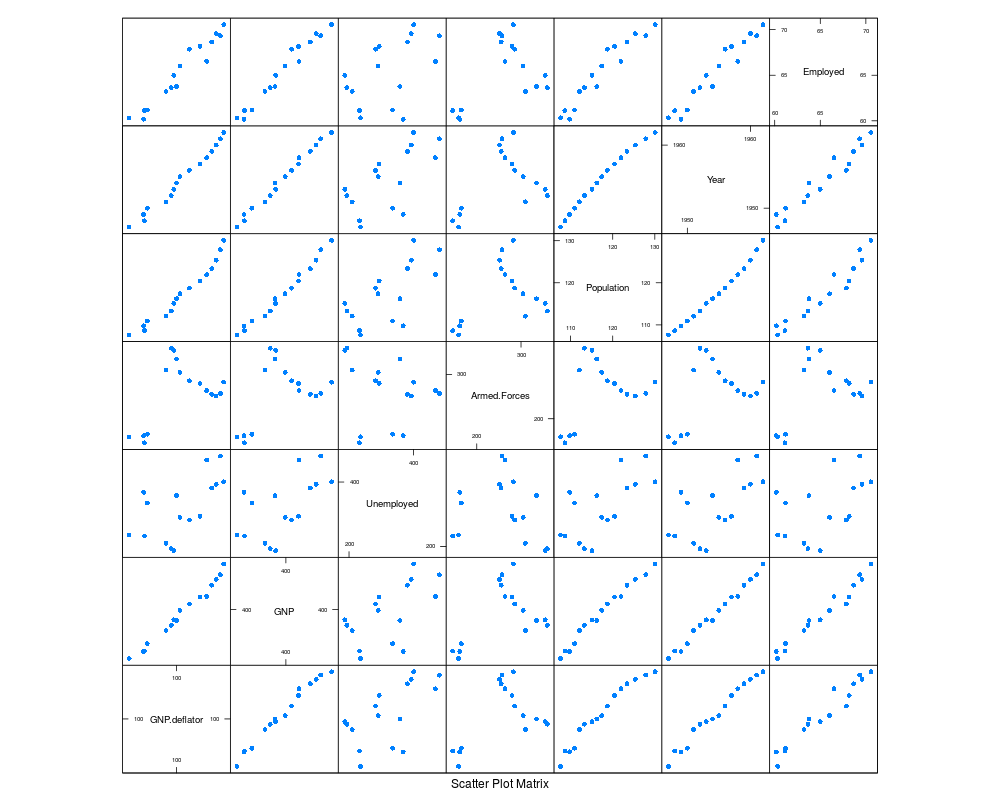
Function based on S-Plus panel.pairs to add the subpanel.scales and panel.cex arguments.DescriptionFunction based on S-Plus Usage
panel.pairs.hh(x, y, z, subscripts, pscales, subpanel = panel.splom,
           varnames = dimnames(x)[[2]], ...,
           subpanel.scales, panel.cex=par()$cex)
Arguments
Value
Author(s)Richard M. Heiberger <rmh@temple.edu> See Also
Examples
if.R(s={
     longley <- data.frame(longley.x, Employed = longley.y)
     },r={
     data(longley)
     })

if.R(s=
     splom( ~ longley, pch=16, cex=.55,
           superpanel=panel.pairs.hh, subpanel.scales=list(cex=.8),
           pscales=2,
           panel.cex=.8)
     ,r=
     splom( ~ longley, pch=16,
           pscales=2,
           varname.cex=.8,
           axis.text.cex=.5)
   )
Results
R version 3.3.1 (2016-06-21) -- "Bug in Your Hair"
Copyright (C) 2016 The R Foundation for Statistical Computing
Platform: x86_64-pc-linux-gnu (64-bit)

R is free software and comes with ABSOLUTELY NO WARRANTY.
You are welcome to redistribute it under certain conditions.
Type 'license()' or 'licence()' for distribution details.

R is a collaborative project with many contributors.
Type 'contributors()' for more information and
'citation()' on how to cite R or R packages in publications.

Type 'demo()' for some demos, 'help()' for on-line help, or
'help.start()' for an HTML browser interface to help.
Type 'q()' to quit R.

> library(HH)
Loading required package: lattice
Loading required package: grid
Loading required package: latticeExtra
Loading required package: RColorBrewer
Loading required package: multcomp
Loading required package: mvtnorm
Loading required package: survival
Loading required package: TH.data
Loading required package: MASS

Attaching package: 'TH.data'

The following object is masked from 'package:MASS':

    geyser

Loading required package: gridExtra
> png(filename="/home/ddbj/snapshot/RGM3/R_CC/result/HH/panel.pairs.hh.Rd_%03d_medium.png", width=480, height=480)
> ### Name: panel.pairs.hh
> ### Title: Function based on S-Plus panel.pairs to add the subpanel.scales
> ###   and panel.cex arguments.
> ### Aliases: panel.pairs.hh
> ### Keywords: dplot
>
> ### ** Examples
>
> if.R(s={
+      longley <- data.frame(longley.x, Employed = longley.y)
+      },r={
+      data(longley)
+      })
>
> if.R(s=
+      splom( ~ longley, pch=16, cex=.55,
+            superpanel=panel.pairs.hh, subpanel.scales=list(cex=.8),
+            pscales=2,
+            panel.cex=.8)
+      ,r=
+      splom( ~ longley, pch=16,
+            pscales=2,
+            varname.cex=.8,
+            axis.text.cex=.5)
+    )
>
>
>
>
>
> dev.off()
null device
          1
>
|
Created & Maintained by Osamu Ogasawara (osamu.ogasawara@gmail.com) and 