Supported by Dr. Osamu Ogasawara and  . . |
|
Last data update: 2014.03.03 |
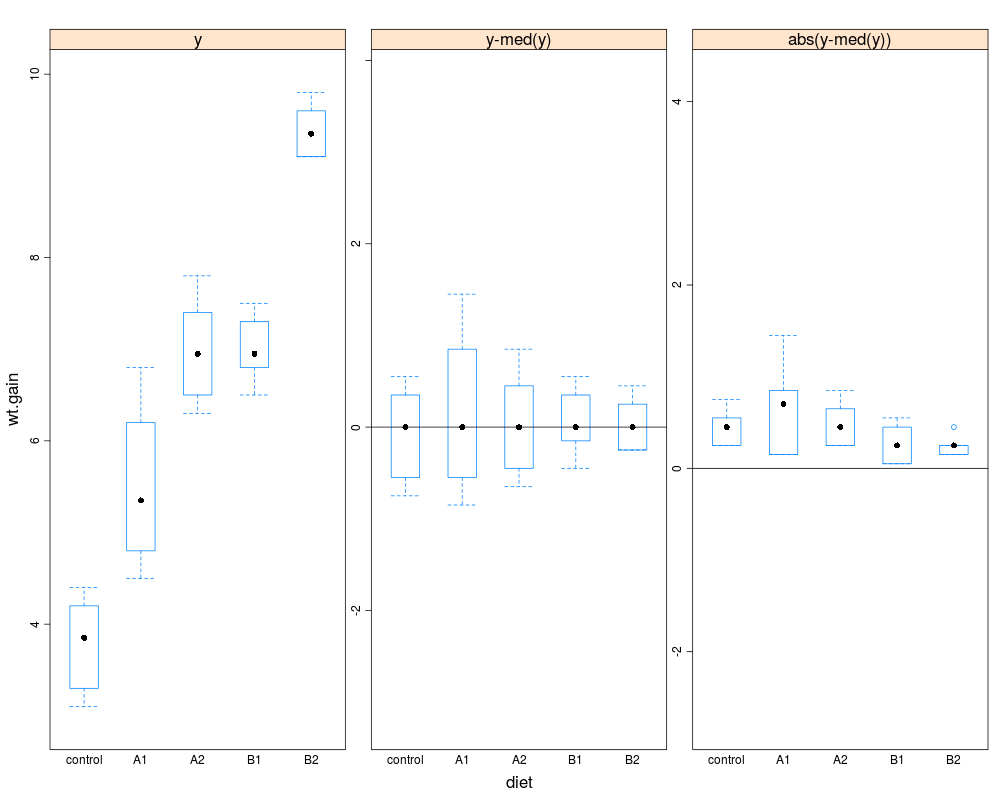
Homogeneity of Variance PlotDescriptionOneway analysis of variance makes the assumption that the variances of
the groups are equal.
Brown and Forsyth, 1974 present the recommended test of this assumption.
The Brown and Forsyth test statistic is the F statistic resulting
from an ordinary one-way analysis of variance on the
absolute deviations from the median. The Usage
hovPlot(x, data = sys.parent(), method = "bf",  ## x is a formula
        transpose = TRUE, ...)

## users will normally use the formula above and will not call the
## method directly.
hovPlot.bf(x, group,  ## x is the response variable
           y.name = deparse(substitute(x)),
           group.name = deparse(substitute(group)),
           transpose = TRUE, ...)

## users will normally use the formula above and will not call the
## panel function directly.
panel.hov(..., transpose = TRUE)
Arguments
Value
Author(s)Richard M. Heiberger <rmh@temple.edu> ReferencesHeiberger, Richard M. and Holland, Burt (2004b). Statistical Analysis and Data Display: An Intermediate Course with Examples in S-Plus, R, and SAS. Springer Texts in Statistics. Springer. ISBN 0-387-40270-5. Brown, M.~B. and Forsyth, A.~B. (1974). Robust tests for equality of variances. Journal of the American Statistical Association, 69:364–367. See Also
Examplesdata(turkey) hov(wt.gain ~ diet, data=turkey) hovPlot(wt.gain ~ diet, data=turkey) Results
R version 3.3.1 (2016-06-21) -- "Bug in Your Hair"
Copyright (C) 2016 The R Foundation for Statistical Computing
Platform: x86_64-pc-linux-gnu (64-bit)

R is free software and comes with ABSOLUTELY NO WARRANTY.
You are welcome to redistribute it under certain conditions.
Type 'license()' or 'licence()' for distribution details.

R is a collaborative project with many contributors.
Type 'contributors()' for more information and
'citation()' on how to cite R or R packages in publications.

Type 'demo()' for some demos, 'help()' for on-line help, or
'help.start()' for an HTML browser interface to help.
Type 'q()' to quit R.

> library(HH)
Loading required package: lattice
Loading required package: grid
Loading required package: latticeExtra
Loading required package: RColorBrewer
Loading required package: multcomp
Loading required package: mvtnorm
Loading required package: survival
Loading required package: TH.data
Loading required package: MASS

Attaching package: 'TH.data'

The following object is masked from 'package:MASS':

    geyser

Loading required package: gridExtra
> png(filename="/home/ddbj/snapshot/RGM3/R_CC/result/HH/plot.hov.Rd_%03d_medium.png", width=480, height=480)
> ### Name: plot.hov
> ### Title: Homogeneity of Variance Plot
> ### Aliases: hovPlot hovPlot.bf panel.hov
> ### Keywords: models hplot
>
> ### ** Examples
>
> data(turkey)
>
> hov(wt.gain ~ diet, data=turkey)

	hov: Brown-Forsyth

data:  wt.gain
F = 2.2257, df:diet = 4, df:Residuals = 25, p-value = 0.09506
alternative hypothesis: variances are not identical

> hovPlot(wt.gain ~ diet, data=turkey)
>
>
>
>
>
> dev.off()
null device
          1
>
|