Supported by Dr. Osamu Ogasawara and  . . |
|
Last data update: 2014.03.03 |
Print a Likert plot as a Population TriangleDescriptionPrints a likert plot in the traditional format for a population pyramid, with the Left and Right sides in separate panels, with the x-tick marks on the left side made positive, and with the y-axis in the Middle. Usage
## S3 method for class 'pyramidLikert'
print(x, ...,
                     panel.width=.48,
                     px=list(
                       L=c(0, panel.width),
                       R=c(1-panel.width, 1),
                       M=c(panel.width, 1-panel.width)),
                    keepLegend=(length(x$legend$bottom$args$text) > 2),
                    xlab.top=list(
                      L=list(x$legend$bottom$args$text[1]),
                      R=list(x$legend$bottom$args$text[2]),
                      M=list(x$ylab, just=1)))

as.pyramidLikert(x, ...,
                 panel.width=.48,
                 px=list(
                   L=c(0, panel.width),
                   R=c(1-panel.width, 1),
                   M=c(panel.width, 1-panel.width)),
                 keepLegend=(length(x$legend$bottom$args$text) > 2),
                 xlab.top=list(
                   L=list(x$legend$bottom$args$text[1]),
                   R=list(x$legend$bottom$args$text[2]),
                   M=list(x$ylab, just=1)))
Arguments
DetailsThis is a print method for population triangles. It is designed for a
likert plot with one left-side level and one right-side level.
It works for any single-panel ValueThe input argument Author(s)Richard M. Heiberger <rmh@temple.edu> See Also
Examples
data(USAge.table) ## from latticeExtra
USA79 <- USAge.table[75:1, 2:1, "1979"]/1000000
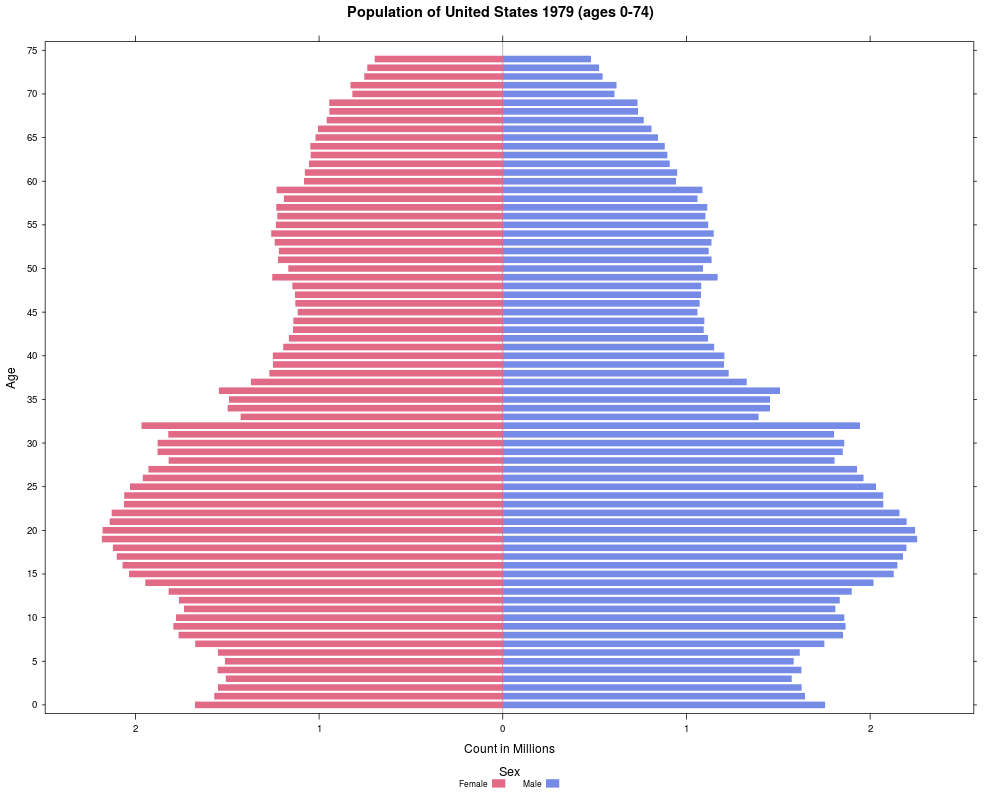
PL <- plot(as.likert(USA79),
main="Population of United States 1979 (ages 0-74)",
xlab="Count in Millions",
ylab="Age",
scales=list(
y=list(
limits=c(0,77),
at=seq(1,76,5),
labels=seq(0,75,5),
tck=.5))
)
PL
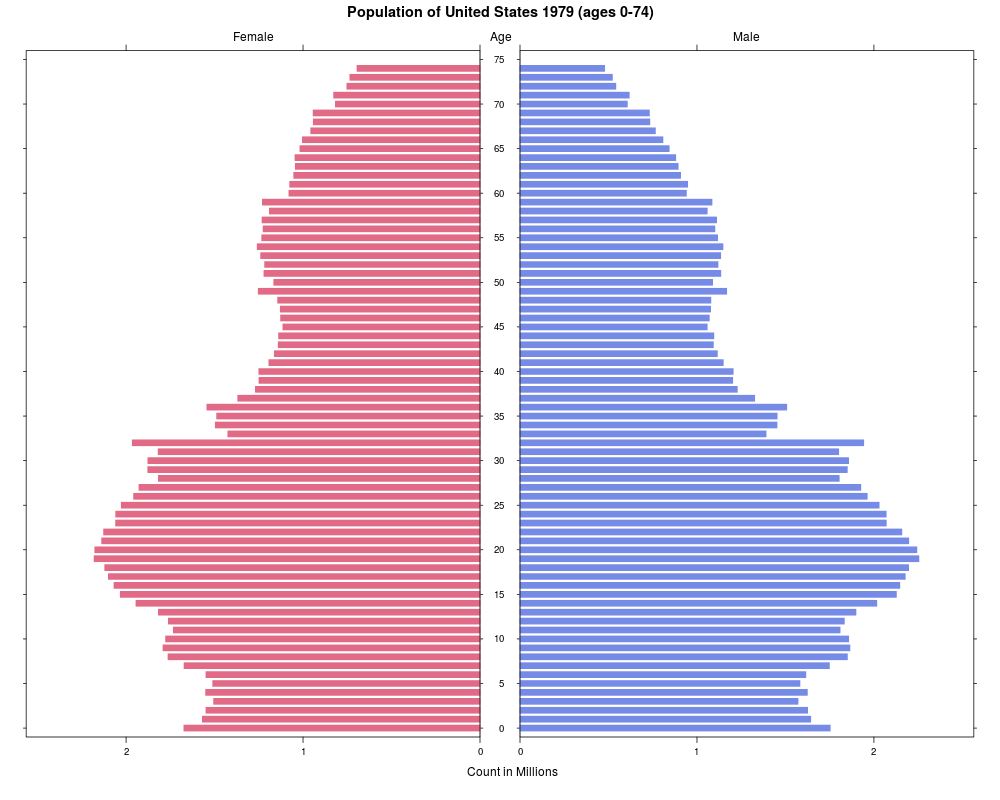
as.pyramidLikert(PL)
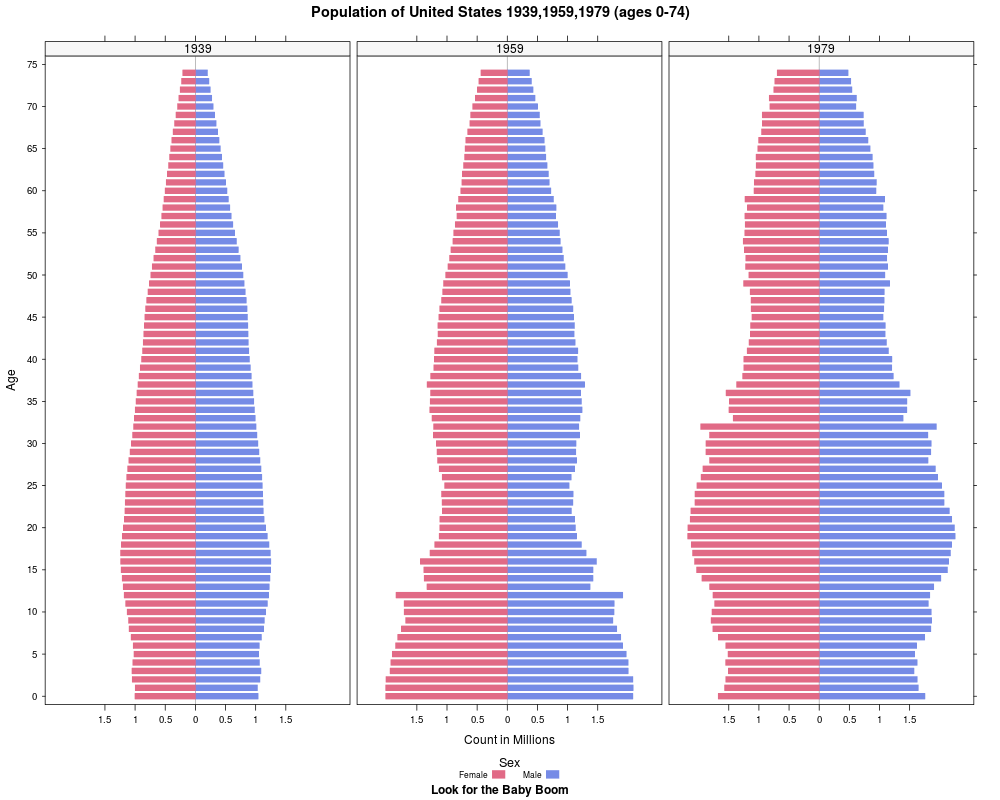
likert(USAge.table[75:1, 2:1, c("1939","1959","1979")]/1000000,
main="Population of United States 1939,1959,1979 (ages 0-74)",
sub="Look for the Baby Boom",
xlab="Count in Millions",
ylab="Age",
scales=list(
y=list(
limits=c(0,77),
at=seq(1,76,5),
labels=seq(0,75,5),
tck=.5)),
strip.left=FALSE, strip=TRUE,
layout=c(3,1), between=list(x=.5))
## For additional examples, see demo(PoorChildren, package="HH")
Results
R version 3.3.1 (2016-06-21) -- "Bug in Your Hair"
Copyright (C) 2016 The R Foundation for Statistical Computing
Platform: x86_64-pc-linux-gnu (64-bit)

R is free software and comes with ABSOLUTELY NO WARRANTY.
You are welcome to redistribute it under certain conditions.
Type 'license()' or 'licence()' for distribution details.

R is a collaborative project with many contributors.
Type 'contributors()' for more information and
'citation()' on how to cite R or R packages in publications.

Type 'demo()' for some demos, 'help()' for on-line help, or
'help.start()' for an HTML browser interface to help.
Type 'q()' to quit R.

> library(HH)
Loading required package: lattice
Loading required package: grid
Loading required package: latticeExtra
Loading required package: RColorBrewer
Loading required package: multcomp
Loading required package: mvtnorm
Loading required package: survival
Loading required package: TH.data
Loading required package: MASS

Attaching package: 'TH.data'

The following object is masked from 'package:MASS':

    geyser

Loading required package: gridExtra
> png(filename="/home/ddbj/snapshot/RGM3/R_CC/result/HH/pyramidLikert.Rd_%03d_medium.png", width=480, height=480)
> ### Name: pyramidLikert
> ### Title: Print a Likert plot as a Population Triangle
> ### Aliases: print.pyramidLikert as.pyramidLikert
> ### Keywords: hplot
>
> ### ** Examples
>
>
> data(USAge.table)  ## from latticeExtra
> USA79 <- USAge.table[75:1, 2:1, "1979"]/1000000
> PL <- plot(as.likert(USA79),
+                      main="Population of United States 1979 (ages 0-74)",
+                      xlab="Count in Millions",
+                      ylab="Age",
+                      scales=list(
+                        y=list(
+                          limits=c(0,77),
+                          at=seq(1,76,5),
+                          labels=seq(0,75,5),
+                          tck=.5))
+                         )
> PL
> as.pyramidLikert(PL)
>
> likert(USAge.table[75:1, 2:1, c("1939","1959","1979")]/1000000,
+        main="Population of United States 1939,1959,1979 (ages 0-74)",
+        sub="Look for the Baby Boom",
+        xlab="Count in Millions",
+        ylab="Age",
+        scales=list(
+          y=list(
+            limits=c(0,77),
+            at=seq(1,76,5),
+            labels=seq(0,75,5),
+            tck=.5)),
+        strip.left=FALSE, strip=TRUE,
+        layout=c(3,1), between=list(x=.5))
>
>
> ## For additional examples, see demo(PoorChildren, package="HH")
>
>
>
>
>
>
> dev.off()
null device
          1
>
|