Supported by Dr. Osamu Ogasawara and  . . |
|
Last data update: 2014.03.03 |
Extend matrix reshaping functions to trellis objects.DescriptionExtend matrix reshaping functions to trellis objects. See the details section for comparisons with similar functions in the lattice package. Usage
transpose(x)
## S3 method for class 'trellis'
transpose(x)
## Default S3 method:
transpose(x)
## S3 method for class 'trellis'
aperm(a, perm, ...)
## S3 method for class 'trellis'
rbind(..., deparse.level=1,
      combineLimits=TRUE, useOuterStrips=TRUE)
## S3 method for class 'trellis'
cbind(..., deparse.level=1,
      combineLimits=TRUE, useOuterStrips=TRUE)
Arguments
Details
Valuetrellis object constructed from arguments with new dim and layout. Author(s)Richard M. Heiberger <rmh@temple.edu> Examples
F <- xyplot((1:15) ~ (1:15) | rep(factor(letters[3:5]), each=5))
G <- xyplot((1:18) ~ (1:18) | rep(factor(letters[3:5]), each=6))
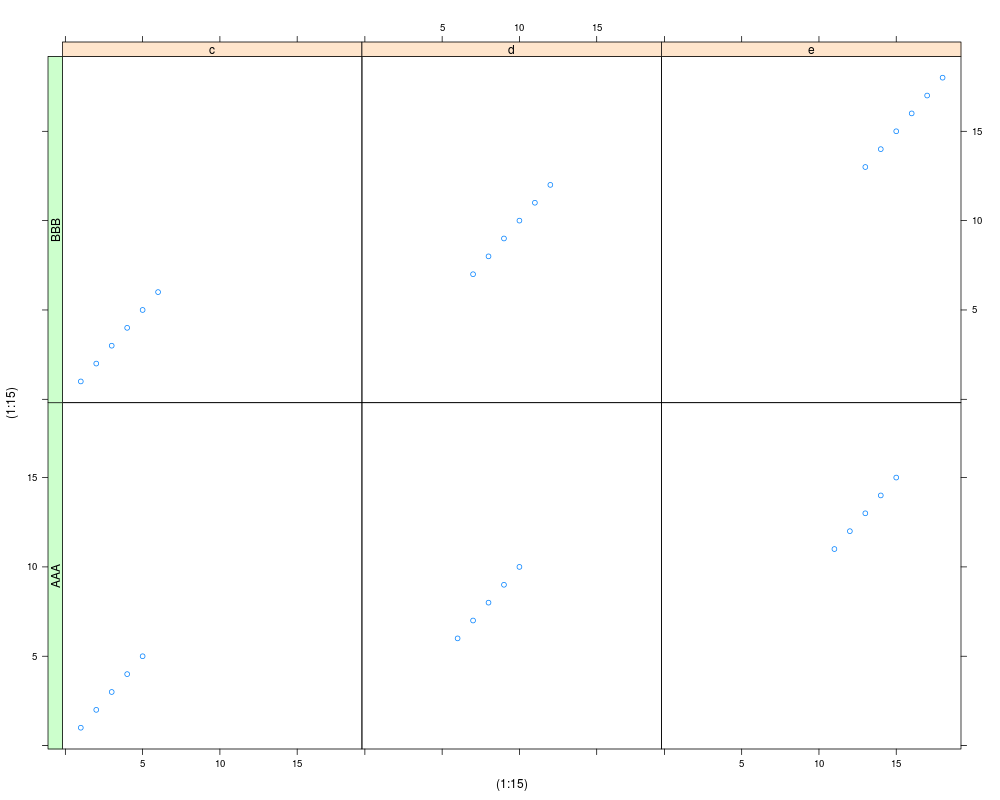
rbind(AAA=F, BBB=G)
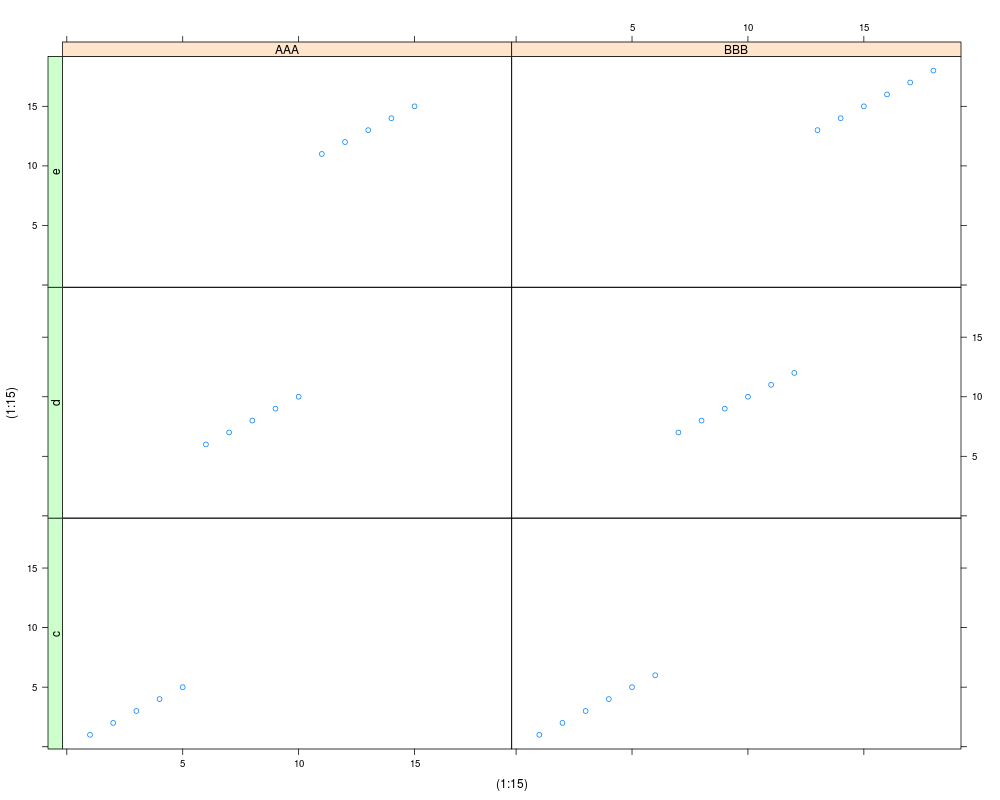
cbind(AAA=F, BBB=G)
tmp <- data.frame(y=1:24,
x=1:24,
a=rep(letters[1:2], each=12),
b=rep(letters[3:5], each=4, times=2),
c=rep(letters[6:9], times=6))
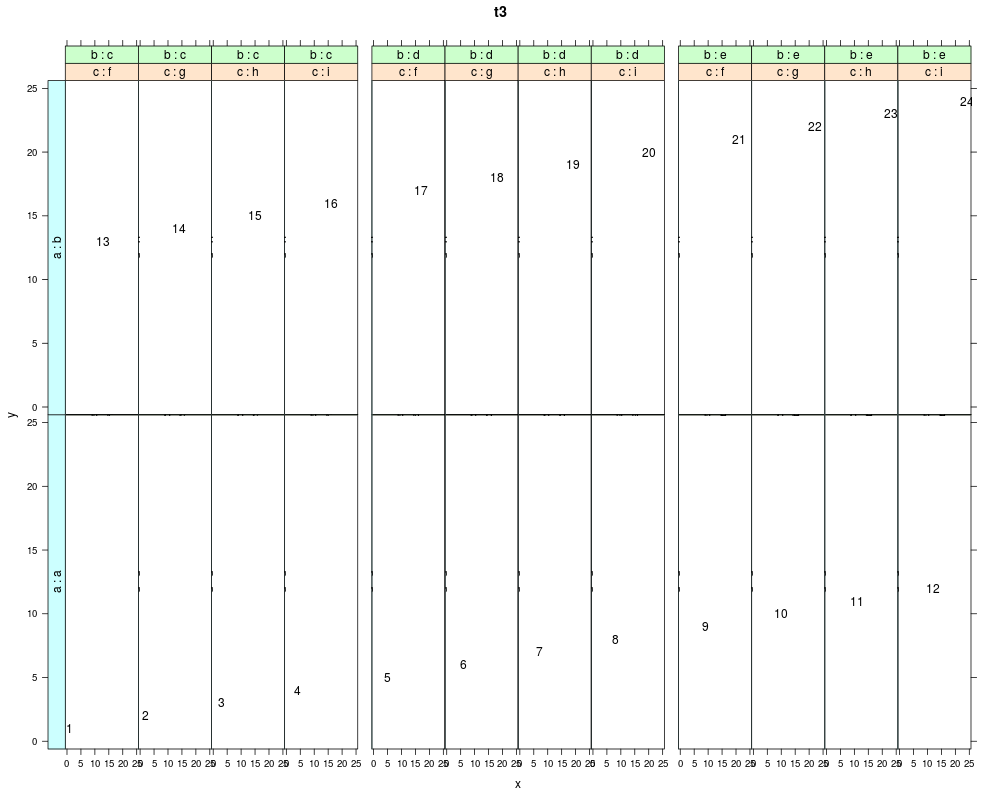
t3 <- xyplot(y ~ x | c*b*a, data=tmp,
panel=function(x, y, ...) panel.text(x, y, y),
scales=list(alternating=FALSE))
## t3
t3u <- update(t3, layout=c(4*3, 2), between=list(x=c(0,0,0,1)), main="t3")
useOuterStripsT2L1(t3u)
## Not run:
## update(t3, layout=c(24, 1))
t3.321 <- aperm(t3, c(3,2,1))
update(t3.321, main="t3.321", layout=c(6,4), between=list(x=c(0,1))) ## 2*3,4
try(transpose(t3)) ## requires a one- or two-dimensional trellis object.
t3.123 <- aperm(t3, c(1,2,3)) ## identity operation
t3.132 <- aperm(t3, c(1,3,2))
t3.213 <- aperm(t3, c(2,1,3))
t3.231 <- aperm(t3, c(2,3,1))
t3.312 <- aperm(t3, c(3,1,2))
t3.321 <- aperm(t3, c(3,2,1))
u3.123 <- update(t3.123, main="t3.123", layout=c(12,2),
between=list(x=c(0,0,0,1))) ## 4*3,2
u3.132 <- update(t3.132, main="t3.132", layout=c(8,3),
between=list(x=c(0,0,0,1))) ## 4*2,3
u3.213 <- update(t3.213, main="t3.213", layout=c(3,8),
between=list(y=c(0,0,0,1)), par.strip.text=list(cex=.8)) ## 3,4*2
u3.231 <- update(t3.231, main="t3.231", layout=c(6,4),
between=list(x=c(0,0,1))) ## 2*3,4
u3.312 <- update(t3.312, main="t3.312", layout=c(2,12),
between=list(y=c(0,0,0,1)), par.strip.text=list(cex=.6)) ## 2,3*4
u3.321 <- update(t3.321, main="t3.321", layout=c(6,4),
between=list(x=c(0,1))) ## 2*3,4
pdf("u5.pdf", width=17, height=22)
print(u3.123, split=c(1,1,2,3), more=TRUE)
print(u3.132, split=c(2,1,2,3), more=TRUE)
print(u3.213, split=c(1,2,2,3), more=TRUE)
print(u3.231, split=c(2,2,2,3), more=TRUE)
print(u3.312, split=c(1,3,2,3), more=TRUE)
print(u3.321, split=c(2,3,2,3), more=FALSE)
dev.off()
try(transpose(t3.123)) ## layout is a matrix, but dim is not.
## End(Not run)
## Not run:
t2 <- xyplot(y ~ x | b*c, data=tmp,
panel=function(x, y, ...) panel.text(x, y, y),
scales=list(alternating=FALSE))
t2
## aperm(t2, 1:2) ## identity
transpose(t2)
aperm(t2, 2:1)
t1a <- xyplot(y ~ x | b, data=tmp[tmp$a=="a",])
t1b <- xyplot(y ~ x | b, data=tmp[tmp$a=="b",])
t1a
t1b
rbind(t1a, t1b)
rbind(AAA=t1a, BBB=t1b)
cbind(t1a, t1b)
cbind(AAA=t1a, BBB=t1b)
## End(Not run)
Results
R version 3.3.1 (2016-06-21) -- "Bug in Your Hair"
Copyright (C) 2016 The R Foundation for Statistical Computing
Platform: x86_64-pc-linux-gnu (64-bit)

R is free software and comes with ABSOLUTELY NO WARRANTY.
You are welcome to redistribute it under certain conditions.
Type 'license()' or 'licence()' for distribution details.

R is a collaborative project with many contributors.
Type 'contributors()' for more information and
'citation()' on how to cite R or R packages in publications.

Type 'demo()' for some demos, 'help()' for on-line help, or
'help.start()' for an HTML browser interface to help.
Type 'q()' to quit R.

> library(HH)
Loading required package: lattice
Loading required package: grid
Loading required package: latticeExtra
Loading required package: RColorBrewer
Loading required package: multcomp
Loading required package: mvtnorm
Loading required package: survival
Loading required package: TH.data
Loading required package: MASS

Attaching package: 'TH.data'

The following object is masked from 'package:MASS':

    geyser

Loading required package: gridExtra
> png(filename="/home/ddbj/snapshot/RGM3/R_CC/result/HH/rbind.trellis.Rd_%03d_medium.png", width=480, height=480)
> ### Name: rbind.trellis
> ### Title: Extend matrix reshaping functions to trellis objects.
> ### Aliases: rbind.trellis transpose.trellis transpose transpose.default
> ###   aperm.trellis cbind.trellis
> ### Keywords: dplot
>
> ### ** Examples
>
> F <- xyplot((1:15) ~ (1:15) | rep(factor(letters[3:5]), each=5))
> G <- xyplot((1:18) ~ (1:18) | rep(factor(letters[3:5]), each=6))
> rbind(AAA=F, BBB=G)
> cbind(AAA=F, BBB=G)
>
> tmp <- data.frame(y=1:24,
+                   x=1:24,
+                   a=rep(letters[1:2], each=12),
+                   b=rep(letters[3:5], each=4, times=2),
+                   c=rep(letters[6:9], times=6))
>
> t3 <- xyplot(y ~ x | c*b*a, data=tmp,
+              panel=function(x, y, ...) panel.text(x, y, y),
+              scales=list(alternating=FALSE))
> ## t3
> t3u <- update(t3, layout=c(4*3, 2), between=list(x=c(0,0,0,1)), main="t3")
> useOuterStripsT2L1(t3u)
>
> ## Not run:
> ##D ## update(t3, layout=c(24, 1))
> ##D
> ##D t3.321 <- aperm(t3, c(3,2,1))
> ##D update(t3.321, main="t3.321", layout=c(6,4), between=list(x=c(0,1))) ## 2*3,4
> ##D
> ##D try(transpose(t3))   ## requires a one- or two-dimensional trellis object.
> ##D
> ##D t3.123 <- aperm(t3, c(1,2,3)) ## identity operation
> ##D t3.132 <- aperm(t3, c(1,3,2))
> ##D t3.213 <- aperm(t3, c(2,1,3))
> ##D t3.231 <- aperm(t3, c(2,3,1))
> ##D t3.312 <- aperm(t3, c(3,1,2))
> ##D t3.321 <- aperm(t3, c(3,2,1))
> ##D
> ##D u3.123 <- update(t3.123, main="t3.123", layout=c(12,2),
> ##D                  between=list(x=c(0,0,0,1))) ## 4*3,2
> ##D u3.132 <- update(t3.132, main="t3.132", layout=c(8,3),
> ##D                  between=list(x=c(0,0,0,1))) ## 4*2,3
> ##D u3.213 <- update(t3.213, main="t3.213", layout=c(3,8),
> ##D                  between=list(y=c(0,0,0,1)), par.strip.text=list(cex=.8)) ## 3,4*2
> ##D u3.231 <- update(t3.231, main="t3.231", layout=c(6,4),
> ##D                  between=list(x=c(0,0,1))) ## 2*3,4
> ##D u3.312 <- update(t3.312, main="t3.312", layout=c(2,12),
> ##D                  between=list(y=c(0,0,0,1)), par.strip.text=list(cex=.6)) ## 2,3*4
> ##D u3.321 <- update(t3.321, main="t3.321", layout=c(6,4),
> ##D                  between=list(x=c(0,1))) ## 2*3,4
> ##D
> ##D pdf("u5.pdf", width=17, height=22)
> ##D print(u3.123, split=c(1,1,2,3), more=TRUE)
> ##D print(u3.132, split=c(2,1,2,3), more=TRUE)
> ##D print(u3.213, split=c(1,2,2,3), more=TRUE)
> ##D print(u3.231, split=c(2,2,2,3), more=TRUE)
> ##D print(u3.312, split=c(1,3,2,3), more=TRUE)
> ##D print(u3.321, split=c(2,3,2,3), more=FALSE)
> ##D dev.off()
> ##D
> ##D try(transpose(t3.123)) ## layout is a matrix, but dim is not.
> ## End(Not run)
>
> ## Not run:
> ##D t2 <- xyplot(y ~ x | b*c, data=tmp,
> ##D              panel=function(x, y, ...) panel.text(x, y, y),
> ##D              scales=list(alternating=FALSE))
> ##D t2
> ##D
> ##D ## aperm(t2, 1:2) ## identity
> ##D
> ##D transpose(t2)
> ##D aperm(t2, 2:1)
> ##D
> ##D t1a <- xyplot(y ~ x | b, data=tmp[tmp$a=="a",])
> ##D t1b <- xyplot(y ~ x | b, data=tmp[tmp$a=="b",])
> ##D t1a
> ##D t1b
> ##D
> ##D rbind(t1a, t1b)
> ##D rbind(AAA=t1a, BBB=t1b)
> ##D
> ##D cbind(t1a, t1b)
> ##D cbind(AAA=t1a, BBB=t1b)
> ## End(Not run)
>
>
>
>
>
> dev.off()
null device
          1
>
|