R: Draw a plot of y vs x from a linear model object, with...
regrresidplot
R Documentation
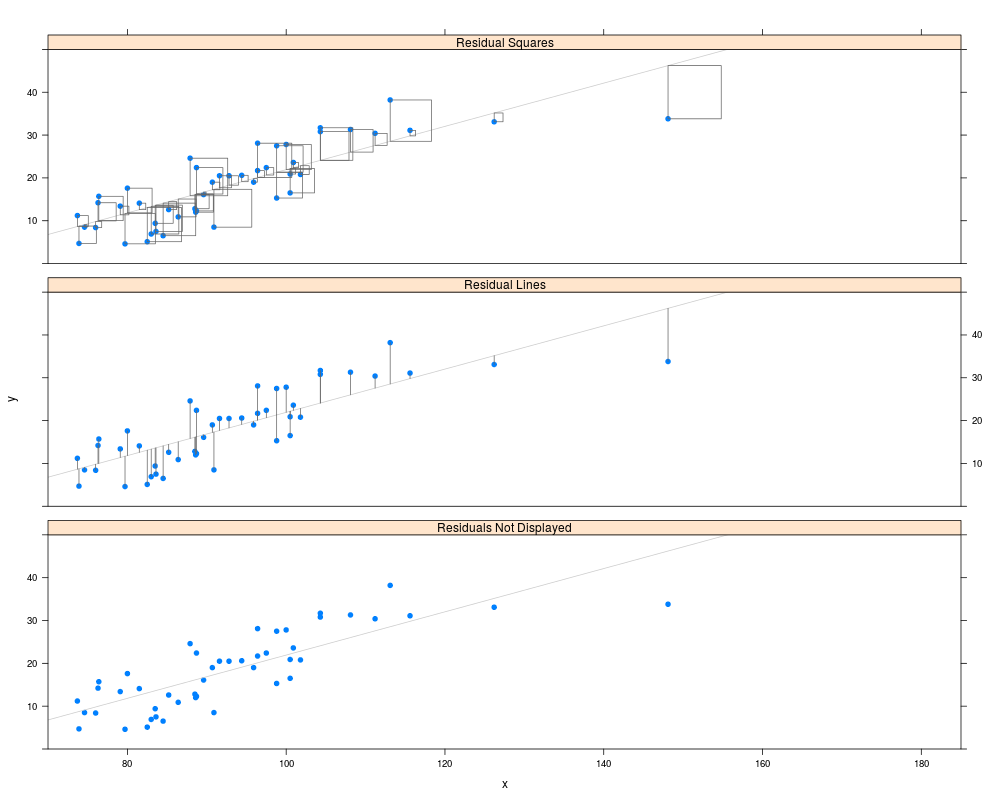
Draw a plot of y vs x from a linear model object, with residuals
indicated by lines or squares.
Description
Draw a plot of response vector y vs predictor variable x from a linear
model object all of whose predictors are a function of x, with residuals
indicated by lines or squares.
Usage
regrresidplot(x, y, resid.plot = FALSE, fit.line=TRUE,
              lm.object = lm(y ~ x), x.name = names(lm.object$model)[2],
              col = trellis.par.get()$plot.symbol$col,
              col.yhat = NULL, col.fit = "gray80", col.resid = "gray40", ...)

panel.residSquare(x, y, yhat, resid.plot = FALSE, col = "black", ...)
Arguments
x
Predictor variable. Must be a vector or a single column.
y
Response variable. Must be a vector or a single column.
yhat
Predicted value of y based on the model in lm.object over the
xlim range of the plot.
resid.plot
Logical or character. Should the residuals from lm.object be
plotted, and how?
Default is FALSE. Alternatives are TRUE for lines and
"square" for squares.
fit.line
Logical. Should the fitted regression line from lm.object be plotted?
Default TRUE.
lm.object
Linear model object of y against some function of x. The default value
is the simple linear regression of lm(y ~ x).
x.name
Name of $x$-variable to be used in the construction of the fitted values.
col
Color of observed points.
col.yhat
Color of fitted points. Default is NULL.
col.fit
Color of fitted line.
col.resid
Color of residuals, either lines or squares depending on the value of
resid.plot.
...
Additional arguments to the panel functions.
Value
regrresidplot returns a "trellis" object.
panel.residSquare is a panel function with no useful returned value.
R version 3.3.1 (2016-06-21) -- "Bug in Your Hair"
Copyright (C) 2016 The R Foundation for Statistical Computing
Platform: x86_64-pc-linux-gnu (64-bit)

R is free software and comes with ABSOLUTELY NO WARRANTY.
You are welcome to redistribute it under certain conditions.
Type 'license()' or 'licence()' for distribution details.

R is a collaborative project with many contributors.
Type 'contributors()' for more information and
'citation()' on how to cite R or R packages in publications.

Type 'demo()' for some demos, 'help()' for on-line help, or
'help.start()' for an HTML browser interface to help.
Type 'q()' to quit R.

> library(HH)
Loading required package: lattice
Loading required package: grid
Loading required package: latticeExtra
Loading required package: RColorBrewer
Loading required package: multcomp
Loading required package: mvtnorm
Loading required package: survival
Loading required package: TH.data
Loading required package: MASS

Attaching package: 'TH.data'

The following object is masked from 'package:MASS':

    geyser

Loading required package: gridExtra
> png(filename="/home/ddbj/snapshot/RGM3/R_CC/result/HH/regrresidplot.Rd_%03d_medium.png", width=480, height=480)
> ### Name: regrresidplot
> ### Title: Draw a plot of y vs x from a linear model object, with residuals
> ###   indicated by lines or squares.
> ### Aliases: regrresidplot panel.residSquare
> ### Keywords: hplot
>
> ### ** Examples
>
> data(fat)
> fat.lm <- lm(bodyfat ~ abdomin, data=fat)
>
> AA <- regrresidplot(fat$abdomin, fat$bodyfat, xlim=c(70,185), ylim=c(0,50))
> BB <- regrresidplot(fat$abdomin, fat$bodyfat, xlim=c(70,185), ylim=c(0,50),
+                     resid.plot="line")
> CC <- regrresidplot(fat$abdomin, fat$bodyfat, xlim=c(70,185), ylim=c(0,50),
+                     resid.plot="square")
>
> update(between=list(y=1),
+        c("Residuals Not Displayed"=AA,
+          "Residual Lines"=BB,
+          "Residual Squares"=CC, layout=c(1,3)))
>
>
>
>
>
> dev.off()
null device
          1
>
 .
.