Supported by Dr. Osamu Ogasawara and  . . |
|
Last data update: 2014.03.03 |
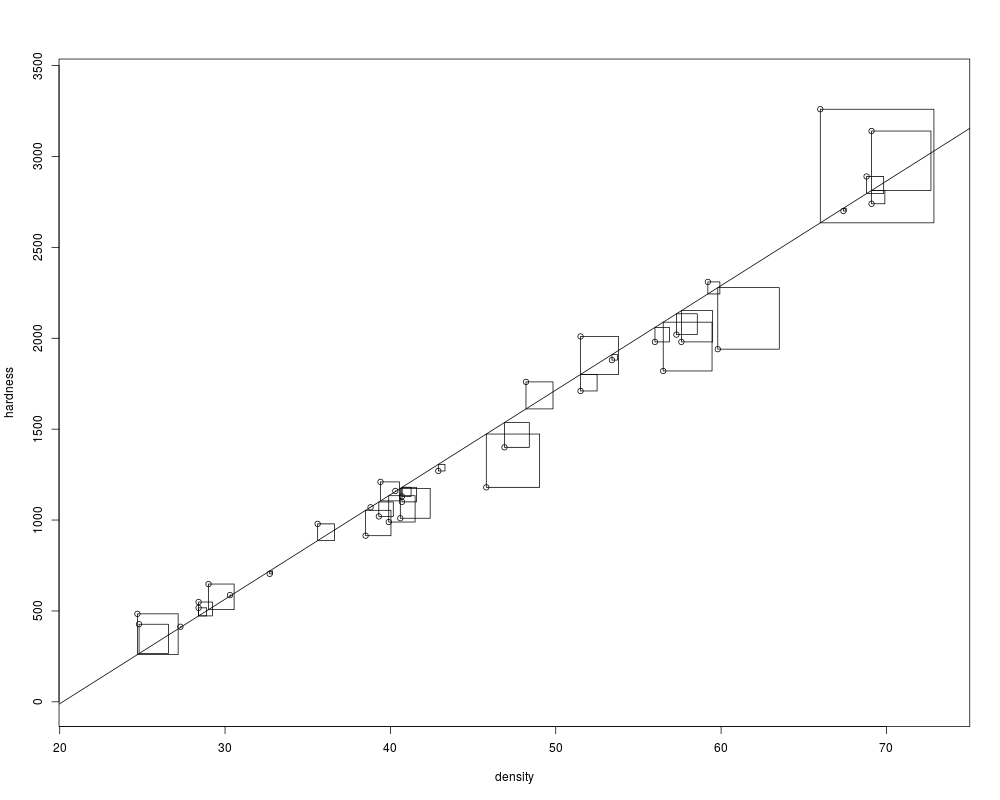
plot squared residuals in inches to match the y-dimensionDescriptionplot squared residuals in inches to match the y-dimension Usageresid.squares(x, y, y.hat, resid.plot = "square", ...) Arguments
DetailsThe goal is to get real squares on the screen or paper. The trick is to play games with the aspect ratio. We find the number of inches that each vertical residual occupies. We then find the number of x-units that corresponds to, and plot a rectangle with height=height in the y-data units and with width=the number of x-units that we just calculated. Author(s)Richard M. Heiberger <rmh@temple.edu> ReferencesHeiberger, Richard M. and Holland, Burt (2004b). Statistical Analysis and Data Display: An Intermediate Course with Examples in S-Plus, R, and SAS. Springer Texts in Statistics. Springer. ISBN 0-387-40270-5. See Also
Examples
data(hardness)
hardness.lin.lm <- lm(hardness ~ density, data=hardness)
plot(hardness ~ density, data=hardness, xlim=c(22,73), ylim=c(0,3400))
abline(hardness.lin.lm)
resid.squares(hardness$density, hardness$hardness,
predict(hardness.lin.lm))
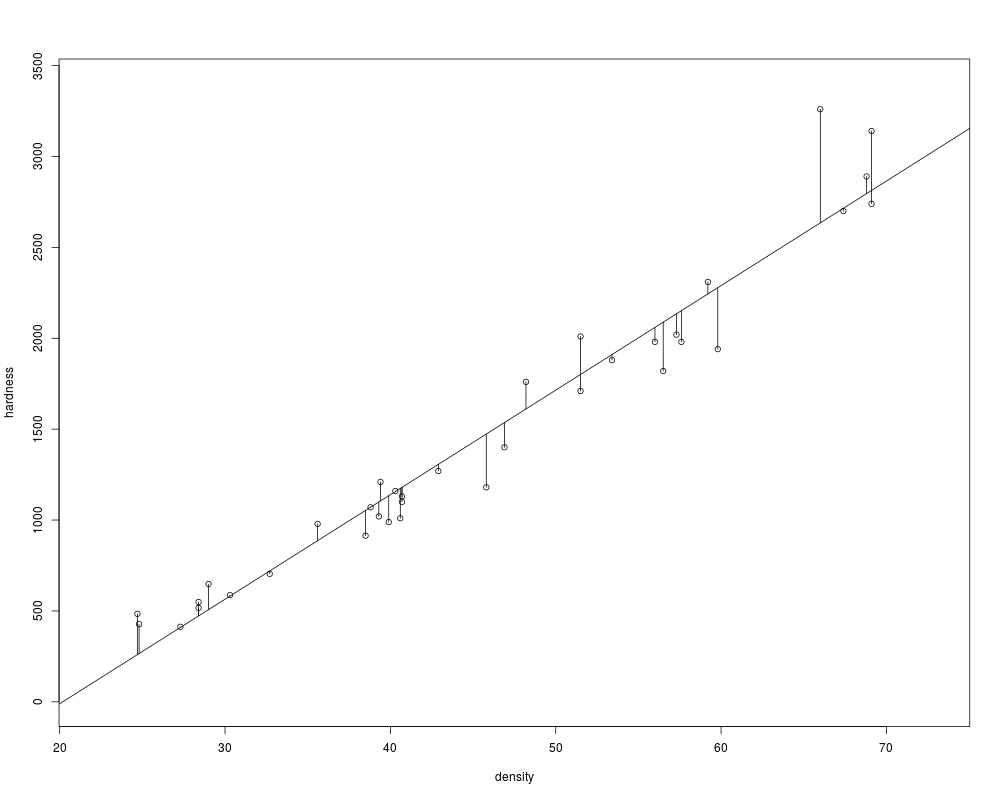
plot(hardness ~ density, data=hardness, xlim=c(22,73), ylim=c(0,3400))
abline(hardness.lin.lm)
resid.squares(hardness$density, hardness$hardness,
predict(hardness.lin.lm), resid.plot = "line")
Results
R version 3.3.1 (2016-06-21) -- "Bug in Your Hair"
Copyright (C) 2016 The R Foundation for Statistical Computing
Platform: x86_64-pc-linux-gnu (64-bit)

R is free software and comes with ABSOLUTELY NO WARRANTY.
You are welcome to redistribute it under certain conditions.
Type 'license()' or 'licence()' for distribution details.

R is a collaborative project with many contributors.
Type 'contributors()' for more information and
'citation()' on how to cite R or R packages in publications.

Type 'demo()' for some demos, 'help()' for on-line help, or
'help.start()' for an HTML browser interface to help.
Type 'q()' to quit R.

> library(HH)
Loading required package: lattice
Loading required package: grid
Loading required package: latticeExtra
Loading required package: RColorBrewer
Loading required package: multcomp
Loading required package: mvtnorm
Loading required package: survival
Loading required package: TH.data
Loading required package: MASS

Attaching package: 'TH.data'

The following object is masked from 'package:MASS':

    geyser

Loading required package: gridExtra
> png(filename="/home/ddbj/snapshot/RGM3/R_CC/result/HH/resid.squares.Rd_%03d_medium.png", width=480, height=480)
> ### Name: resid.squares
> ### Title: plot squared residuals in inches to match the y-dimension
> ### Aliases: resid.squares
> ### Keywords: models regression
>
> ### ** Examples
>
> data(hardness)
>
> hardness.lin.lm  <- lm(hardness ~ density, data=hardness)
>
> plot(hardness ~ density, data=hardness, xlim=c(22,73), ylim=c(0,3400))
> abline(hardness.lin.lm)
> resid.squares(hardness$density, hardness$hardness,
+               predict(hardness.lin.lm))
>
> plot(hardness ~ density, data=hardness, xlim=c(22,73), ylim=c(0,3400))
> abline(hardness.lin.lm)
> resid.squares(hardness$density, hardness$hardness,
+               predict(hardness.lin.lm), resid.plot = "line")
>
>
>
>
>
> dev.off()
null device
          1
>
|