Supported by Dr. Osamu Ogasawara and  . . |
|
Last data update: 2014.03.03 |
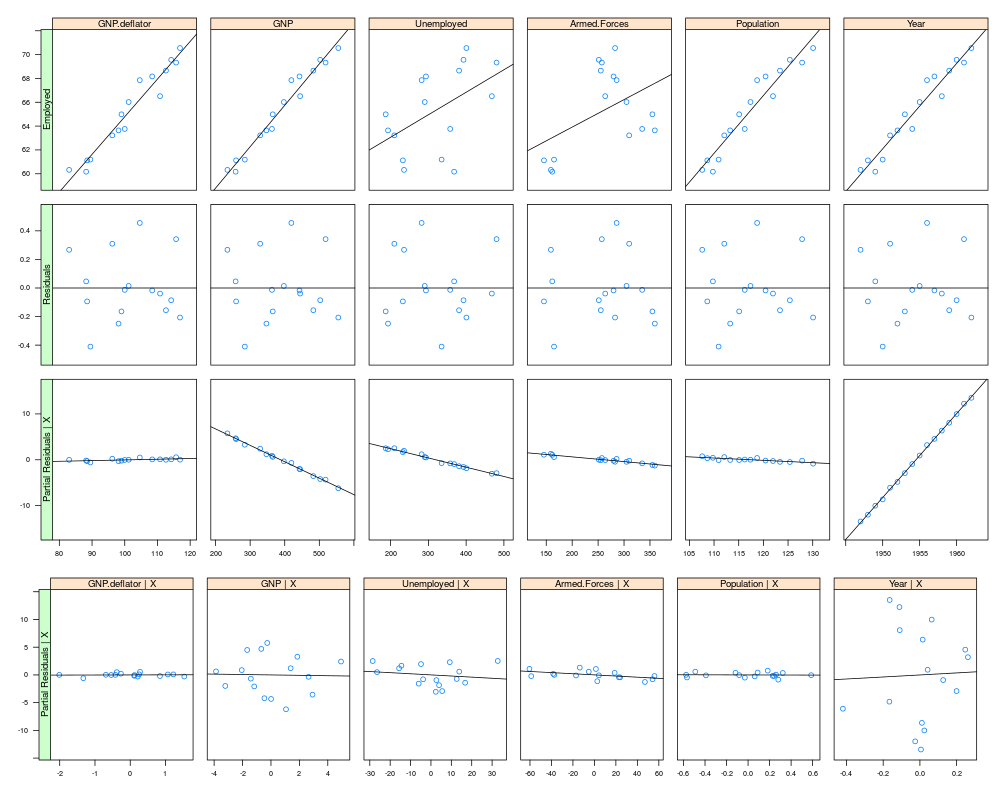
Construct four sets of regression plots: Y against X, residuals against X, partial residuals against X, partial residuals against each X adjusted for all the other X columns.DescriptionConstruct four sets of regression plots. Response variable $Y$ against each $X_j$, residuals $e$ against each $X_j$, partial residuals plots of $e^j$ against each $X_j$, added variable plots of $e^j$ against the residuals of each $X_j$ adjusted for the other $X$ columns. The slopes shown in the panels of both bottom rows are equal to the regression coefficients. Usage
residual.plots.lattice(lm.object, X=dft$x, layout=c(dim(X)[2],1),
                       par.strip.text=list(cex=.8),
                       scales.cex=.6,
                       na.action=na.pass,
                       y.relation="same",
                       ...)
Arguments
Value
Author(s)Richard M. Heiberger <rmh@temple.edu> See Also
Examples
     data(longley)
     longley.lm <- lm( Employed ~ . , data=longley, x=TRUE, y=TRUE)
     residual.plots.lattice(longley.lm)

     ## Not run:
            pdf("longley-resid.pdf", height=9, width=14)
                 print(residual.plots.lattice(longley.lm, pch=19),
                            A4.left=.0125, panel.width=list(5,"cm"))
                 dev.off()

## End(Not run)
Results
R version 3.3.1 (2016-06-21) -- "Bug in Your Hair"
Copyright (C) 2016 The R Foundation for Statistical Computing
Platform: x86_64-pc-linux-gnu (64-bit)

R is free software and comes with ABSOLUTELY NO WARRANTY.
You are welcome to redistribute it under certain conditions.
Type 'license()' or 'licence()' for distribution details.

R is a collaborative project with many contributors.
Type 'contributors()' for more information and
'citation()' on how to cite R or R packages in publications.

Type 'demo()' for some demos, 'help()' for on-line help, or
'help.start()' for an HTML browser interface to help.
Type 'q()' to quit R.

> library(HH)
Loading required package: lattice
Loading required package: grid
Loading required package: latticeExtra
Loading required package: RColorBrewer
Loading required package: multcomp
Loading required package: mvtnorm
Loading required package: survival
Loading required package: TH.data
Loading required package: MASS

Attaching package: 'TH.data'

The following object is masked from 'package:MASS':

    geyser

Loading required package: gridExtra
> png(filename="/home/ddbj/snapshot/RGM3/R_CC/result/HH/residual.plots.lattice.Rd_%03d_medium.png", width=480, height=480)
> ### Name: residual.plots.lattice
> ### Title: Construct four sets of regression plots: Y against X, residuals
> ###   against X, partial residuals against X, partial residuals against
> ###   each X adjusted for all the other X columns.
> ### Aliases: residual.plots.lattice
> ### Keywords: dplot
>
> ### ** Examples
>
>      data(longley)
>      longley.lm <- lm( Employed ~ . , data=longley, x=TRUE, y=TRUE)
>      residual.plots.lattice(longley.lm)
>
>      ## Not run:
> ##D             pdf("longley-resid.pdf", height=9, width=14)
> ##D                  print(residual.plots.lattice(longley.lm, pch=19),
> ##D                             A4.left=.0125, panel.width=list(5,"cm"))
> ##D                  dev.off()
> ##D
> ## End(Not run)
>
>
>
>
>
> dev.off()
null device
          1
>
|
Created & Maintained by Osamu Ogasawara (osamu.ogasawara@gmail.com) and 