This is a function that can be used to create (modified) dotplots for the
diagnostic measures. The plot allows the user to understand the distribution
of the diagnostic measure and visually identify unusual cases.
value(s) specifying the boundary for unusual values of the
diagnostic. The cutoff(s) can either be supplied by the user, or automatically
calculated using measures of internal scaling if cutoff = "internal"
name
what diagnostic is being plotted
(one of "cooks.distance", "mdffits", "covratio",
"covtrace", "rvc", or "leverage").
this is used for the calculation of "internal" cutoffs
modify
specifies the geom to be used to produce a
space-saving modification: either "dotplot" or "boxplot"
...
other arguments to be passed to qplot()
Note
The resulting plot uses coord_flip to rotate the plot, so when
adding customized axis labels you will need to flip the usage of
xlab and ylab.
library(lme4)
fm <- lmer(Reaction ~ Days + (Days | Subject), sleepstudy)
# Subject level deletion and diagnostics
subject.del <- case_delete(model = fm, group = "Subject", type = "both")
subject.diag <- diagnostics(subject.del)
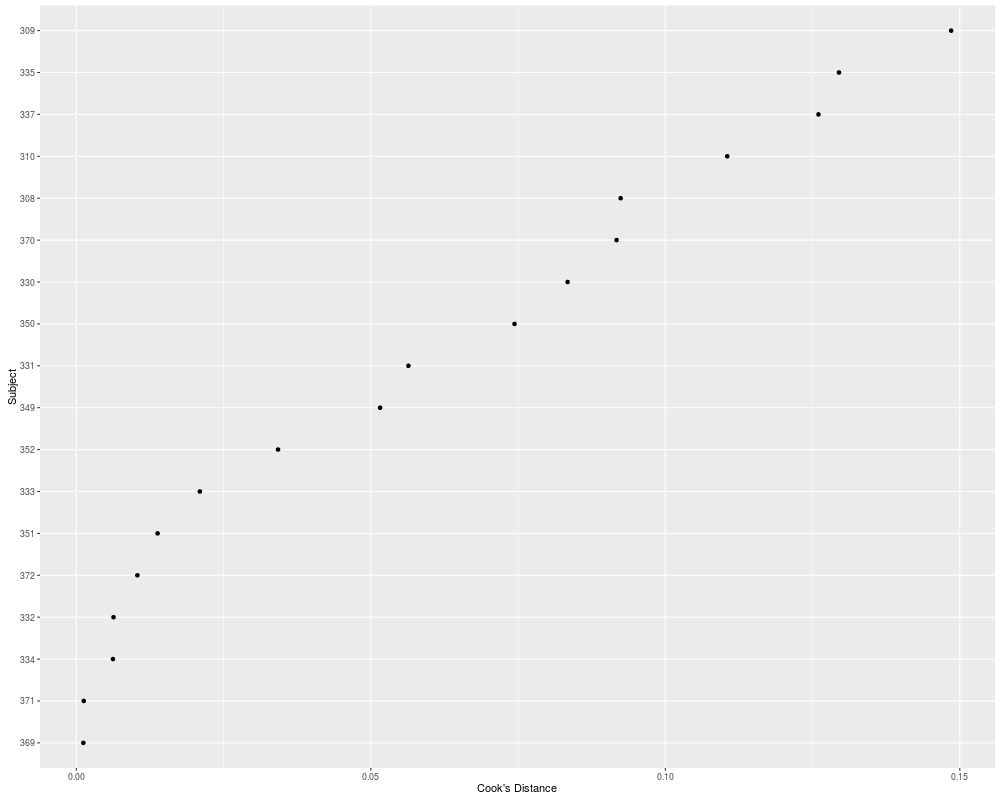
dotplot_diag(x = COOKSD, index = IDS, data = subject.diag[["fixef_diag"]],
name = "cooks.distance", modify = FALSE,
xlab = "Subject", ylab = "Cook's Distance")
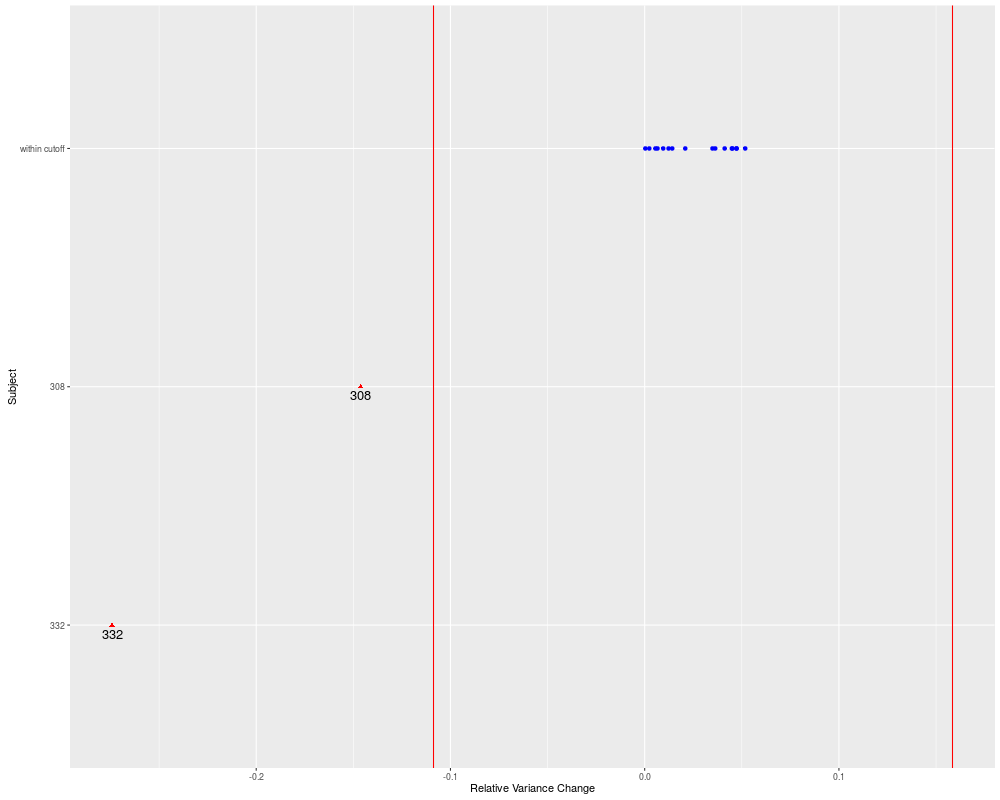
dotplot_diag(x = sigma2, index = IDS, data = subject.diag[["varcomp_diag"]],
name = "rvc", modify = "dotplot", cutoff = "internal",
xlab = "Subject", ylab = "Relative Variance Change")
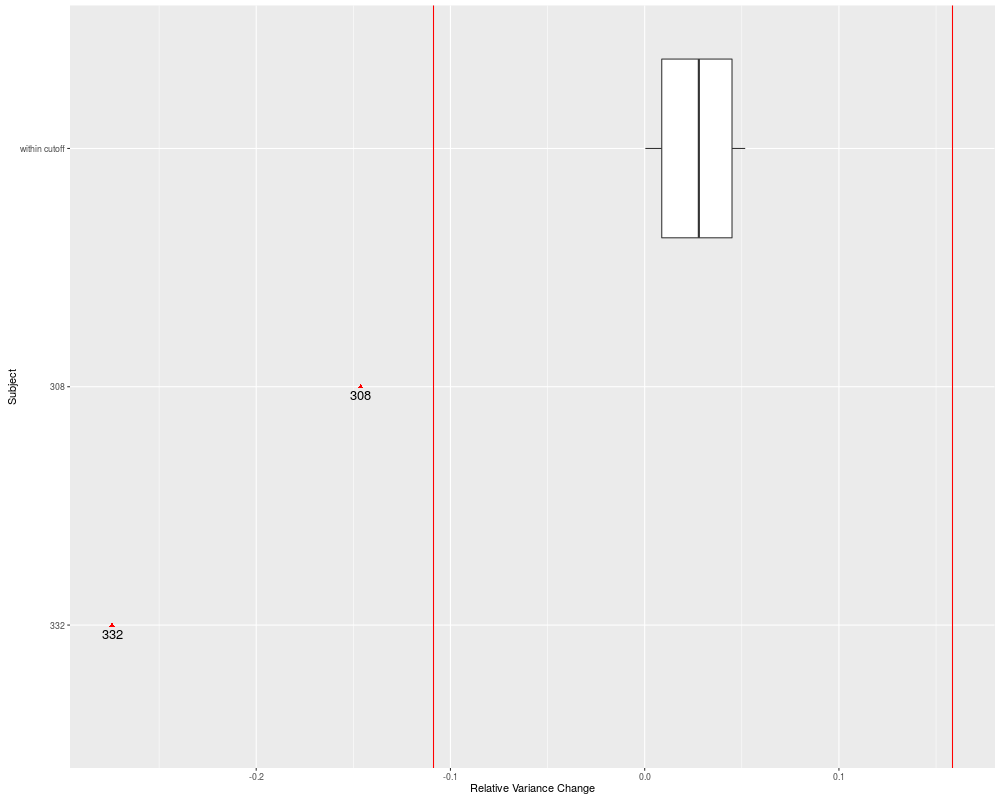
dotplot_diag(x = sigma2, index = IDS, data = subject.diag[["varcomp_diag"]],
name = "rvc", modify = "boxplot", cutoff = "internal",
xlab = "Subject", ylab = "Relative Variance Change")
Results
R version 3.3.1 (2016-06-21) -- "Bug in Your Hair"
Copyright (C) 2016 The R Foundation for Statistical Computing
Platform: x86_64-pc-linux-gnu (64-bit)

R is free software and comes with ABSOLUTELY NO WARRANTY.
You are welcome to redistribute it under certain conditions.
Type 'license()' or 'licence()' for distribution details.

R is a collaborative project with many contributors.
Type 'contributors()' for more information and
'citation()' on how to cite R or R packages in publications.

Type 'demo()' for some demos, 'help()' for on-line help, or
'help.start()' for an HTML browser interface to help.
Type 'q()' to quit R.

> library(HLMdiag)

Attaching package: 'HLMdiag'

The following object is masked from 'package:stats':

    covratio

> png(filename="/home/ddbj/snapshot/RGM3/R_CC/result/HLMdiag/dotplot_diag.Rd_%03d_medium.png", width=480, height=480)
> ### Name: dotplot_diag
> ### Title: Dot plots for influence diagnostics
> ### Aliases: dotplot_diag
> ### Keywords: hplot
>
> ### ** Examples
>
> library(lme4)
Loading required package: Matrix
> fm <- lmer(Reaction ~ Days + (Days | Subject), sleepstudy)
>
> # Subject level deletion and diagnostics
> subject.del  <- case_delete(model = fm, group = "Subject", type = "both")
> subject.diag <- diagnostics(subject.del)
>
> dotplot_diag(x = COOKSD, index = IDS, data = subject.diag[["fixef_diag"]],
+              name = "cooks.distance", modify = FALSE,
+              xlab = "Subject", ylab = "Cook's Distance")
>
> dotplot_diag(x = sigma2, index = IDS, data = subject.diag[["varcomp_diag"]],
+              name = "rvc", modify = "dotplot", cutoff = "internal",
+              xlab = "Subject", ylab = "Relative Variance Change")
>
> dotplot_diag(x = sigma2, index = IDS, data = subject.diag[["varcomp_diag"]],
+              name = "rvc", modify = "boxplot", cutoff = "internal",
+              xlab = "Subject", ylab = "Relative Variance Change")
>
>
>
>
>
> dev.off()
null device
          1
>
 .
.