column name of the data frame X specifying the groups
factor1
column name of the data frame X of the first factor variable
subject
column name of the data frame X identifying the subjects
data
column name of the data frame X identifying the measured data
xlab
label of the x-axis of the plot
ylab
label of the y-axis of the plot
Value
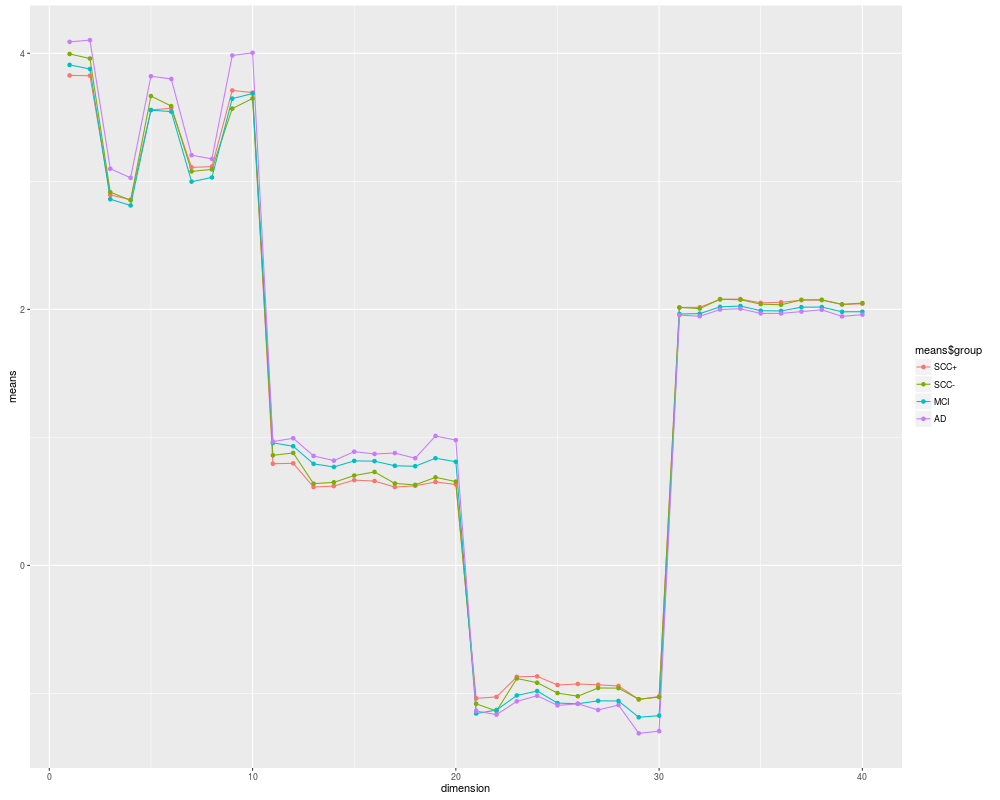
Plots profiles of the groups.
Examples
data(EEG)
head(EEG)

# plots profiles according to groups with
# subplot factor called 'dimension' in data.frame
hrm.plot(EEG,"group", "dimension", "subject", "value")
Results
R version 3.3.1 (2016-06-21) -- "Bug in Your Hair"
Copyright (C) 2016 The R Foundation for Statistical Computing
Platform: x86_64-pc-linux-gnu (64-bit)

R is free software and comes with ABSOLUTELY NO WARRANTY.
You are welcome to redistribute it under certain conditions.
Type 'license()' or 'licence()' for distribution details.

R is a collaborative project with many contributors.
Type 'contributors()' for more information and
'citation()' on how to cite R or R packages in publications.

Type 'demo()' for some demos, 'help()' for on-line help, or
'help.start()' for an HTML browser interface to help.
Type 'q()' to quit R.

> library(HRM)
Loading required package: MASS
Loading required package: matrixcalc
Loading required package: plyr
Loading required package: ggplot2
Loading required package: reshape2
> png(filename="/home/ddbj/snapshot/RGM3/R_CC/result/HRM/hrm.plot.Rd_%03d_medium.png", width=480, height=480)
> ### Name: hrm.plot
> ### Title: Plots profiles of the groups.
> ### Aliases: hrm.plot
>
> ### ** Examples
>
> data(EEG)
> head(EEG)
  group    value sex subject variable region dimension
1  SCC+ 2.804180   W       1        1      1         1
2  SCC+ 2.285004   W       1        1      2         2
3  SCC+ 1.473094   W       1        1      3         3
4  SCC+ 1.548939   W       1        1      4         4
5  SCC+ 2.160346   W       1        1      5         5
6  SCC+ 2.143525   W       1        1      6         6
>
> # plots profiles according to groups with
> # subplot factor called 'dimension' in data.frame
> hrm.plot(EEG,"group", "dimension", "subject", "value")
>
>
>
>
>
> dev.off()
null device
          1
>
 .
.