Supported by Dr. Osamu Ogasawara and  . . |
|
Last data update: 2014.03.03 |
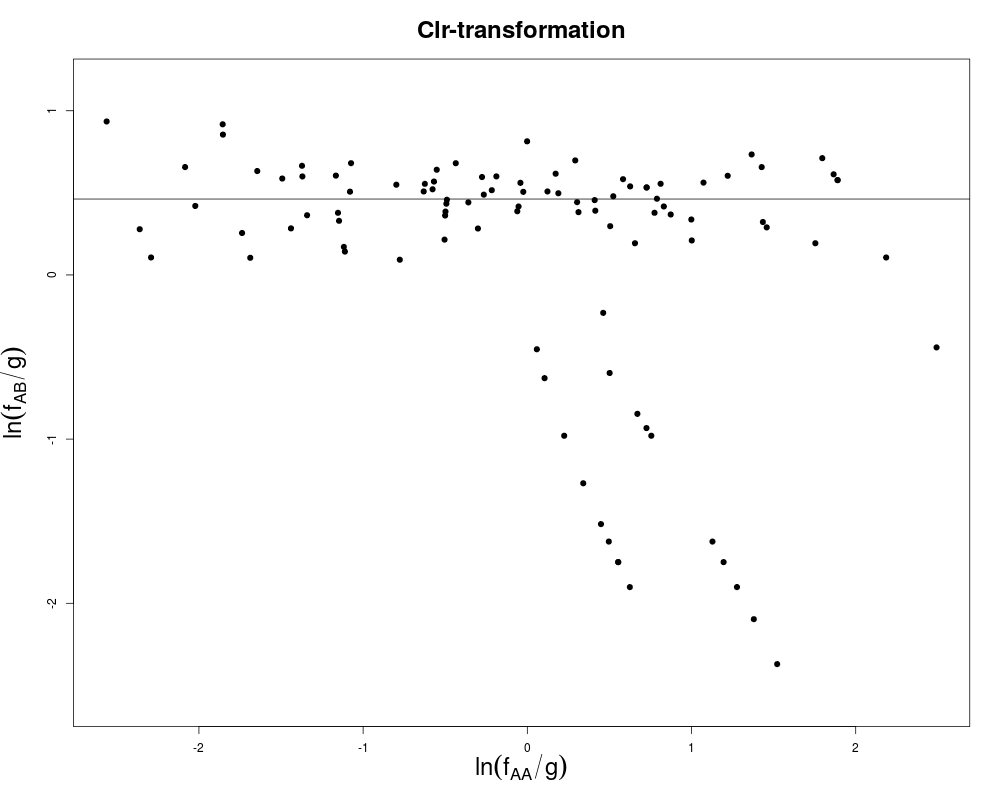
Plot genetic markers in centred log-ratio coordinatesDescription
UsageHWClrPlot(X, zeroadj = 0.5) Arguments
ValueNULL Author(s)Jan Graffelman (jan.graffelman@upc.edu) ReferencesGraffelman, J. and Egozcue, J. J. (2011) Hardy-Weinberg equilibrium: a non-parametric compositional approach. In: Vera Pawlowsky-Glahn and Antonella Buccianti (eds.) Compositional Data Analysis: Theory and Applications, John Wiley & Sons, Ltd, pp. 207-215 See Also
ExamplesX <- HWClo(HWData(100,100)) HWClrPlot(X) Results
R version 3.3.1 (2016-06-21) -- "Bug in Your Hair"
Copyright (C) 2016 The R Foundation for Statistical Computing
Platform: x86_64-pc-linux-gnu (64-bit)

R is free software and comes with ABSOLUTELY NO WARRANTY.
You are welcome to redistribute it under certain conditions.
Type 'license()' or 'licence()' for distribution details.

R is a collaborative project with many contributors.
Type 'contributors()' for more information and
'citation()' on how to cite R or R packages in publications.

Type 'demo()' for some demos, 'help()' for on-line help, or
'help.start()' for an HTML browser interface to help.
Type 'q()' to quit R.

> library(HardyWeinberg)
Loading required package: mice
Loading required package: Rcpp
mice 2.25 2015-11-09
> png(filename="/home/ddbj/snapshot/RGM3/R_CC/result/HardyWeinberg/HWClrPlot.Rd_%03d_medium.png", width=480, height=480)
> ### Name: HWClrPlot
> ### Title: Plot genetic markers in centred log-ratio coordinates
> ### Aliases: HWClrPlot
> ### Keywords: aplot
>
> ### ** Examples
>
>    X <- HWClo(HWData(100,100))
>    HWClrPlot(X)
NULL
>
>
>
>
>
> dev.off()
null device
          1
>
|
Created & Maintained by Osamu Ogasawara (osamu.ogasawara@gmail.com) and 