Supported by Dr. Osamu Ogasawara and  . . |
|
Last data update: 2014.03.03 |
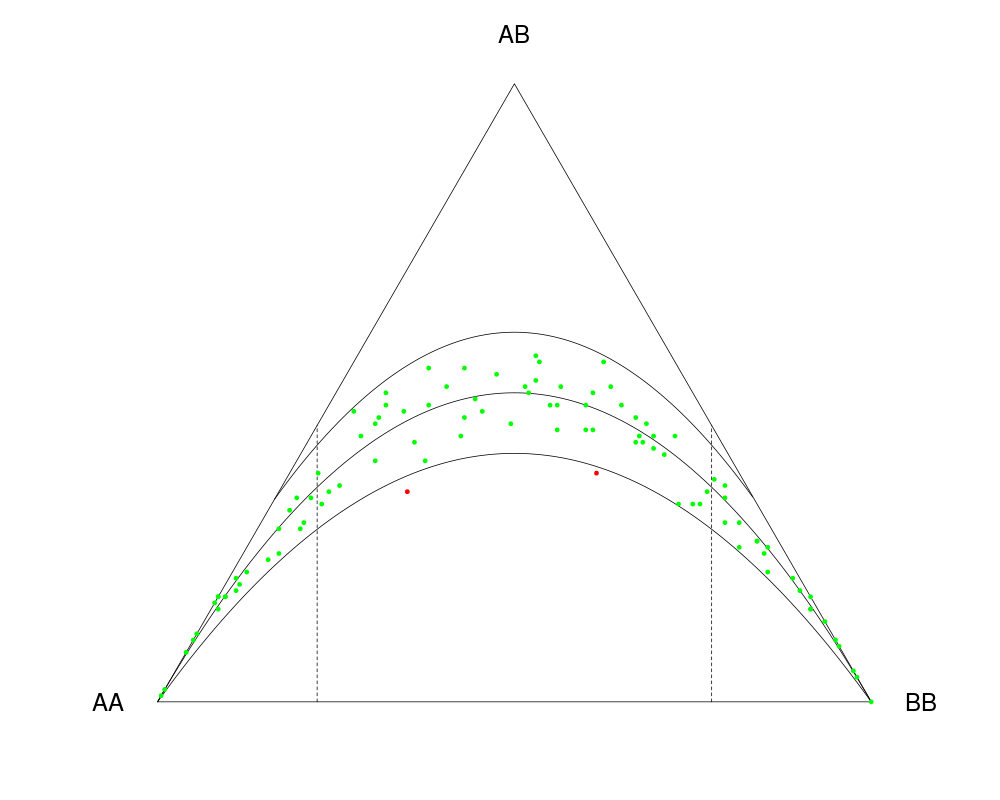
Graphical tests for Hardy-Weinberg equilibriumDescriptionThe package HardyWeinberg offers tools for exploring diallelic genetic marker data. It offers all classical tests (chi-square, exact, likelihood-ratio and permutation tests) for Hardy-Weinberg equilibrium, functions for power computation and for the simulation of marker data under equilibrium and disequilibrium. Functions for testing equilibrium in the presence of missing data by using multiple imputation are provided. The package also supplies various graphical tools such as ternary plots with acceptance regions, log-ratio plots and Q-Q plots for exploring the equilibrium status of a large set of diallelic markers. Details
The most important function of the package is Author(s)Jan Graffelman Maintainer: Jan Graffelman <jan.graffelman@upc.edu> ReferencesWeir, B.S. (1996) Genetic Data Analysis II. Sinauer Associates, Massachusetts. Graffelman, J. and Morales, J. (2008) Graphical tests for Hardy-Weinberg equilibrium based on the ternary plot. Human Heredity 65(2):77-84. http://dx.doi.org/10.1159/000108939. Graffelman, J. (2015) Exploring Diallelic Genetic Markers: The HardyWeinberg Package. Journal of Statistical Software 64(3): 1-23. http://www.jstatsoft.org/v64/i03/. Exampleslibrary(HardyWeinberg) # draw random SNPs from a population that is in HWE set.seed(123) m <- 100 # number of markers n <- 100 # sample size X <- HWData(n,m) out <- HWTernaryPlot(X,100,region=1,vertex.cex=2,signifcolour=TRUE) Results
R version 3.3.1 (2016-06-21) -- "Bug in Your Hair"
Copyright (C) 2016 The R Foundation for Statistical Computing
Platform: x86_64-pc-linux-gnu (64-bit)

R is free software and comes with ABSOLUTELY NO WARRANTY.
You are welcome to redistribute it under certain conditions.
Type 'license()' or 'licence()' for distribution details.

R is a collaborative project with many contributors.
Type 'contributors()' for more information and
'citation()' on how to cite R or R packages in publications.

Type 'demo()' for some demos, 'help()' for on-line help, or
'help.start()' for an HTML browser interface to help.
Type 'q()' to quit R.

> library(HardyWeinberg)
Loading required package: mice
Loading required package: Rcpp
mice 2.25 2015-11-09
> png(filename="/home/ddbj/snapshot/RGM3/R_CC/result/HardyWeinberg/HardyWeinberg-package.Rd_%03d_medium.png", width=480, height=480)
> ### Name: HardyWeinberg-package
> ### Title: Graphical tests for Hardy-Weinberg equilibrium
> ### Aliases: HardyWeinberg-package HardyWeinberg
> ### Keywords: package
>
> ### ** Examples
>
>
> library(HardyWeinberg)
>
> # draw random SNPs from a population that is in HWE
>
> set.seed(123)
>
> m <- 100 # number of markers
> n <- 100 # sample size
>
> X <- HWData(n,m)
> out <- HWTernaryPlot(X,100,region=1,vertex.cex=2,signifcolour=TRUE)
>
>
>
>
>
>
> dev.off()
null device
          1
>
|