Supported by Dr. Osamu Ogasawara and  . . |
|
Last data update: 2014.03.03 |
Process an adjacency graph into a HivePlotData objectDescriptionThis function will take an adjacency graph and convert it into a basic Usageadj2HPD(M = NULL, axis.cols = NULL, type = "2D", desc = NULL, ...) Arguments
DetailsThis function produces a "bare bones" ValueA Author(s)Bryan A. Hanson, DePauw University. hanson@depauw.edu Vesna Memisevic contributed a fix that limited this function to bipartite networks (changed in v. 0.2-12). Referenceshttp://academic.depauw.edu/~hanson/HiveR/HiveR.html See Also
Examples
### Example 1: a bipartite network
### Note: this first example has questionable scientific value!
### The purpose is to show how to troubleshoot and
### manipulate a HivePlotData object.
require(bipartite)
data(Safariland) # This is a bipartite network
# You may wish to do ?Safariland or ?Safari for background
hive1 <- adj2HPD(Safariland, desc = "Safariland data set from bipartite")
sumHPD(hive1)
# Note that all nodes are one axis with radius 1. Process further:
hive2 <- mineHPD(hive1, option = "rad <- tot.edge.count")
sumHPD(hive2)
# All nodes still on 1 axis but degree has been used to set radius
# Process further:
hive3 <- mineHPD(hive2, option = "axis <- source.man.sink")
sumHPD(hive3, chk.all = TRUE)
# Note that mineHPD is generating some warnings, telling us
# that the first 9 nodes were not assigned to an axis. Direct
# inspection of the data shows that these nodes are insects
# that did not visit any of the flowers in this particular study.
# Pretty up a few things, then plot:
hive3$edges$weight <- sqrt(hive3$edges$weight)*0.5
hive3$nodes$size <- 0.5
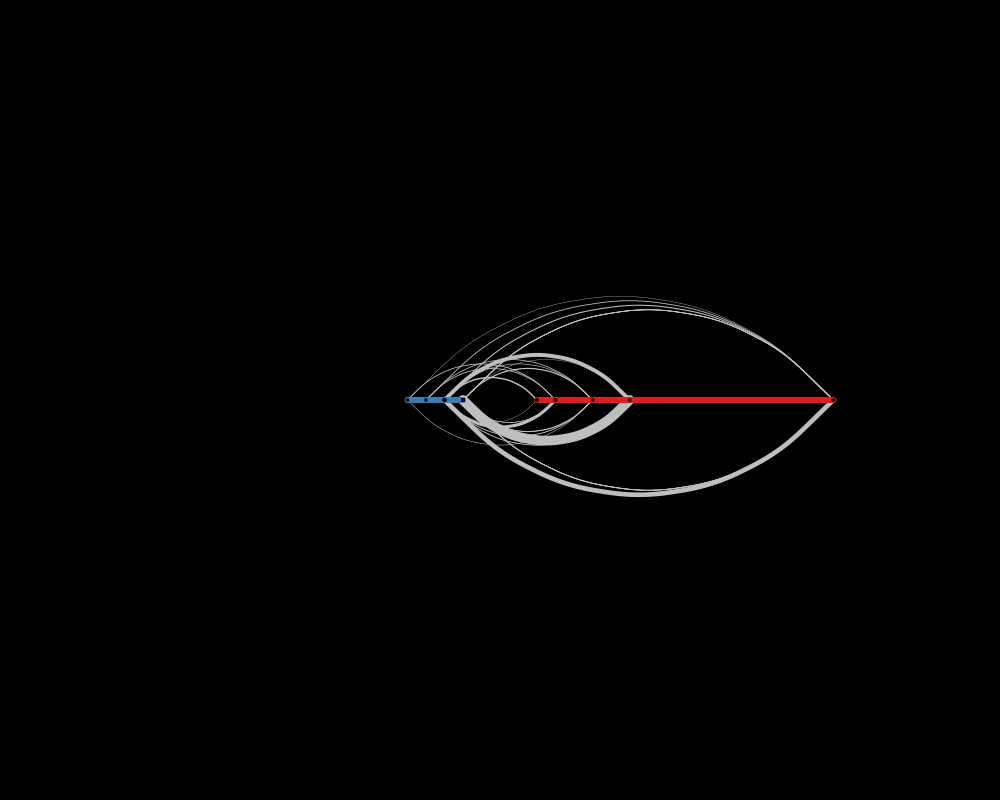
plotHive(hive3)
# This is a one-sided hive plot of 2 axes, which results
# from the curvature of the splines. We can manually fix
# this by reversing the ends of edges as follows:
for (n in seq(1, length(hive3$edges$id1), by = 2)) {
a <- hive3$edges$id1[n]
b <- hive3$edges$id2[n]
hive3$edges$id1[n] <- b
hive3$edges$id2[n] <- a
}
plotHive(hive3)
### Example 2, a simple random adjacency matrix
set.seed(31)
nr <- 20
nc <- 15
M <- matrix(floor(runif(nc*nr, 0, 10)), ncol = nc)
colnames(M) <- sample(c(letters, LETTERS), nc, replace = FALSE)
rownames(M) <- sample(c(letters, LETTERS), nr, replace = FALSE)
hive4 <- adj2HPD(M)
sumHPD(hive4)
Results
R version 3.3.1 (2016-06-21) -- "Bug in Your Hair"
Copyright (C) 2016 The R Foundation for Statistical Computing
Platform: x86_64-pc-linux-gnu (64-bit)

R is free software and comes with ABSOLUTELY NO WARRANTY.
You are welcome to redistribute it under certain conditions.
Type 'license()' or 'licence()' for distribution details.

R is a collaborative project with many contributors.
Type 'contributors()' for more information and
'citation()' on how to cite R or R packages in publications.

Type 'demo()' for some demos, 'help()' for on-line help, or
'help.start()' for an HTML browser interface to help.
Type 'q()' to quit R.

> library(HiveR)
> png(filename="/home/ddbj/snapshot/RGM3/R_CC/result/HiveR/adj2HPD.Rd_%03d_medium.png", width=480, height=480)
> ### Name: adj2HPD
> ### Title: Process an adjacency graph into a HivePlotData object
> ### Aliases: adj2HPD
> ### Keywords: utilities
>
> ### ** Examples
>
> ### Example 1: a bipartite network
> ### Note: this first example has questionable scientific value!
> ### The purpose is to show how to troubleshoot and
> ### manipulate a HivePlotData object.
>
> require(bipartite)
Loading required package: bipartite
Loading required package: vegan
Loading required package: permute
Loading required package: lattice
This is vegan 2.4-0
Loading required package: sna
sna: Tools for Social Network Analysis
Version 2.3-2 created on 2014-01-13.
copyright (c) 2005, Carter T. Butts, University of California-Irvine
 For citation information, type citation("sna").
 Type help(package="sna") to get started.

 This is bipartite 2.06
 For latest changes see versionlog in  ?"bipartite-package".
 For citation see: citation("bipartite").
 Have a nice time plotting and analysing two-mode networks.


Attaching package: 'bipartite'

The following object is masked from 'package:vegan':

    nullmodel

> data(Safariland) # This is a bipartite network
>
> # You may wish to do ?Safariland or ?Safari for background
>
> hive1 <- adj2HPD(Safariland, desc = "Safariland data set from bipartite")
Warning message:
In brewer.pal(length(unique(HPD$nodes$axis)), "Set1") :
  minimal value for n is 3, returning requested palette with 3 different levels

> sumHPD(hive1)
	Safariland data set from bipartite
	This hive plot data set contains 36 nodes on 1 axes and 39 edges.
	It is a  2D data set.

		Axis 1 has 36 nodes spanning radii from 1 to 1

		Axes 1 and 1 share 39 edges

>
> # Note that all nodes are one axis with radius 1. Process further:
>
> hive2 <- mineHPD(hive1, option = "rad <- tot.edge.count")
> sumHPD(hive2)
	Safariland data set from bipartite
	This hive plot data set contains 36 nodes on 1 axes and 39 edges.
	It is a  2D data set.

		Axis 1 has 36 nodes spanning radii from 1 to 17

		Axes 1 and 1 share 39 edges

>
> # All nodes still on 1 axis but degree has been used to set radius
>
> # Process further:
>
> hive3 <- mineHPD(hive2, option = "axis <- source.man.sink")
Warning messages:
1: In mineHPD(hive2, option = "axis <- source.man.sink") :
  node 1 was not assigned to an axis
2: In mineHPD(hive2, option = "axis <- source.man.sink") :
  node 2 was not assigned to an axis
3: In mineHPD(hive2, option = "axis <- source.man.sink") :
  node 3 was not assigned to an axis
4: In mineHPD(hive2, option = "axis <- source.man.sink") :
  node 4 was not assigned to an axis
5: In mineHPD(hive2, option = "axis <- source.man.sink") :
  node 5 was not assigned to an axis
6: In mineHPD(hive2, option = "axis <- source.man.sink") :
  node 6 was not assigned to an axis
7: In mineHPD(hive2, option = "axis <- source.man.sink") :
  node 7 was not assigned to an axis
8: In mineHPD(hive2, option = "axis <- source.man.sink") :
  node 8 was not assigned to an axis
9: In mineHPD(hive2, option = "axis <- source.man.sink") :
  node 9 was not assigned to an axis
> sumHPD(hive3, chk.all = TRUE)
	Safariland data set from bipartite
	This hive plot data set contains 36 nodes on 2 axes and 39 edges.
	It is a  2D data set.

		Axis 1 has 9 nodes spanning radii from 1 to 17
		Axis 2 has 27 nodes spanning radii from 1 to 4

		Axes 1 and 2 share 39 edges


	 No edges were found that start and end on the same point

	 No edges were found that start and end on the same axis

	 No orphaned nodes were found

	 No edges that jump axes were found
>
> # Note that mineHPD is generating some warnings, telling us
> # that the first 9 nodes were not assigned to an axis.  Direct
> # inspection of the data shows that these nodes are insects
> # that did not visit any of the flowers in this particular study.
>
> # Pretty up a few things, then plot:
>
> hive3$edges$weight <- sqrt(hive3$edges$weight)*0.5
> hive3$nodes$size <- 0.5
> plotHive(hive3)
>
> # This is a one-sided hive plot of 2 axes, which results
> # from the curvature of the splines.  We can manually fix
> # this by reversing the ends of edges as follows:
>
> for (n in seq(1, length(hive3$edges$id1), by = 2)) {
+ 	a <- hive3$edges$id1[n]
+ 	b <- hive3$edges$id2[n]
+ 	hive3$edges$id1[n] <- b
+ 	hive3$edges$id2[n] <- a
+ 	}
>
> plotHive(hive3)
>
> ### Example 2, a simple random adjacency matrix
> set.seed(31)
> nr <- 20
> nc <- 15
> M <- matrix(floor(runif(nc*nr, 0, 10)), ncol = nc)
> colnames(M) <- sample(c(letters, LETTERS), nc, replace = FALSE)
> rownames(M) <- sample(c(letters, LETTERS), nr, replace = FALSE)
> hive4 <- adj2HPD(M)
Warning message:
In brewer.pal(length(unique(HPD$nodes$axis)), "Set1") :
  minimal value for n is 3, returning requested palette with 3 different levels

> sumHPD(hive4)
	No description provided
	This hive plot data set contains 30 nodes on 1 axes and 269 edges.
	It is a  2D data set.

		Axis 1 has 30 nodes spanning radii from 1 to 1

		Axes 1 and 1 share 269 edges

>
>
>
>
>
> dev.off()
null device
          1
>
|