label(x) retrieves the label attribute of x.
label(x) <- "a label" stores the label attribute, and also puts
the class labelled as the first class of x (for S-Plus
this class is not used and methods for handling this class are
not defined so the "label" and "units" attributes are lost
upon subsetting). The reason for having this class is so that the
subscripting method for labelled, [.labelled, can preserve
the label attribute in S. Also, the print
method for labelled objects prefaces the print with the object's
label (and units if there). If the variable is also given
a "units" attribute using the units function, subsetting
the variable (using [.labelled) will also retain the
"units" attribute.
label can optionally append a "units" attribute to the
string, and it can optionally return a string or expression (for R's
plotmath facility) suitable for plotting. labelPlotmath
is a function that also has this function, when the input arguments are
the 'label' and 'units' rather than a vector having those
attributes. When plotmath mode is used to construct labels, the
'label' or 'units' may contain math expressions but they
are typed verbatim if they contain percent signs, blanks, or
underscores. labelPlotmath can optionally create the
expression as a character string, which is useful in building
ggplot commands.
For Surv objects, label first looks to see if there is
an overall "label" attribute for the object, then it looks for
saved attributes that Surv put in the "inputAttributes"
object, looking first at the event variable, then time2,
and finally time. You can restrict the looking by specifying
type.
labelLatex constructs suitable LaTeX labels a variable or from the
label and units arguments, optionally right-justifying
units if hfill=TRUE. This is useful when making tables
when the variable in question is not a column heading. If x
is specified, label and units values are extracted from
its attributes instead of from the other arguments.
Label (actually Label.data.frame) is a function which generates
S source code that makes the labels in all the variables in a data
frame easy to edit.
llist is like list except that it preserves the names or
labels of the component variables in the variables label
attribute. This can be useful when looping over variables or using
sapply or lapply. By using llist instead of
list one can annotate the output with the current variable's name
or label. llist also defines a names attribute for the
list and pulls the names from the arguments' expressions for
non-named arguments.
plotmathTranslate is a simple function that translates certain
character strings to character strings that can be used as part of Rplotmath expressions. If the input string has a space or percent
inside, the string is surrounded by a call to plotmath's
paste function.
as.data.frame.labelled is a utility function that is called by
[.data.frame. It is just a copy of as.data.frame.vector.
data.frame.labelled is another utility function, that adds a
class "labelled" to every variable in a data frame that has a
"label" attribute but not a "labelled" class.
relevel.labelled is a method for preserving labels with the relevel function.
reLabelled is used to add a 'labelled' class back to
variables in data frame that have a 'label' attribute but no 'labelled'
class. Useful for changing cleanup.import()'d S-Plus data
frames back to general form for R and old versions of S-Plus.
Usage
label(x, default=NULL, ...)

## Default S3 method:
label(x, default=NULL, units=plot, plot=FALSE,
      grid=FALSE, ...)

## S3 method for class 'Surv'
label(x, default=NULL, units=plot, plot=FALSE,
      grid=FALSE, type=c('any', 'time', 'event'), ...)

## S3 method for class 'data.frame'
label(x, default=NULL, self=FALSE, ...)

label(x, ...) <- value

## Default S3 replacement method:
label(x, ...) <- value

## S3 replacement method for class 'data.frame'
label(x, self=TRUE, ...) <- value

labelPlotmath(label, units=NULL, plotmath=TRUE, grid=FALSE, chexpr=FALSE)

labelLatex(x=NULL, label='', units='', size='smaller[2]',
           hfill=FALSE, bold=FALSE, default='', double=FALSE)

## S3 method for class 'labelled'
print(x, ...)   ## or x - calls print.labelled

Label(object, ...)

## S3 method for class 'data.frame'
Label(object, file='', append=FALSE, ...)

llist(..., labels=TRUE)

plotmathTranslate(x)

data.frame.labelled(object)

## S3 method for class 'labelled'
relevel(x, ...)

reLabelled(object)

combineLabels(...)
Arguments
x
any object (for plotmathTranslate is a character string). For relevel is a factor variable.
self
lgoical, where to interact with the object or its components
units
set to TRUE to append the 'units' attribute (if present)
to the returned label. The 'units' are surrounded
by brackets. For labelPlotmath and labelLatex is a
character string containing the units of measurement. When
plot is TRUE, units defaults to TRUE.
plot
set to TRUE to return a label suitable for R's plotmath
facility (returns an expression instead of a character string) if R is
in effect. If units is also TRUE, and if both
'label' and 'units' attributes are present, the
'units' will appear after the label but in smaller type and
will not be surrounded by brackets.
default
if x does not have a 'label' attribute and
default (a character string) is specified, the label will be
taken as default. For labelLatex the default
is the name of the first argument if it is a variable and not a label.
grid
Currently R's lattice and grid functions do not support
plotmath expressions for xlab and ylab
arguments. When using lattice functions in R, set the
argument grid to TRUE so that labelPlotmath can
return an ordinary character string instead of an expression.
type
for Surv objects specifies the type of element for
which to restrict the search for a label
label
a character string containing a variable's label
plotmath
set to TRUE to have labelMathplot return an expression
for plotting using R's plotmath facility. If R is not in
effect, an ordinary character string is returned.
chexpr
set to TRUE to have labelPlotmath return a
character string of the form "expression(...)"
size
LaTeX size for units. Default is two sizes smaller
than label, which assumes that the LaTeX relsize
package is in use.
hfill
set to TRUE to right-justify units in the
field. This is useful when multiple labels are being put into rows
in a LaTeX tabular environment, and will cause a problem if
the label is used in an environment where hfill is not
appropriate.
bold
set to TRUE to have labelLatex put the
label in bold face.
double
set to TRUE to represent backslash in LaTeX as
four backslashes in place of two. This is needed if, for example,
you need to convert the result using as.formula
value
the label of the object, or "".
object
a data frame
...
a list of variables or expressions to be formed into a list.
Ignored for print.labelled. For relevel is the level (a single character string) to become the new reference (first) category.
file
the name of a file to which to write S source code. Default is
"", meaning standard output.
append
set to TRUE to append code generated by Label to file file
labels
set to FALSE to make llist ignore the variables' label attribute and
use the variables' names.
Value
label returns the label attribute of x, if any; otherwise, "".
label is used
most often for the individual variables in data frames. The function
sas.get copies labels over from SAS if they exist.
See Also
sas.get, describe
Examples
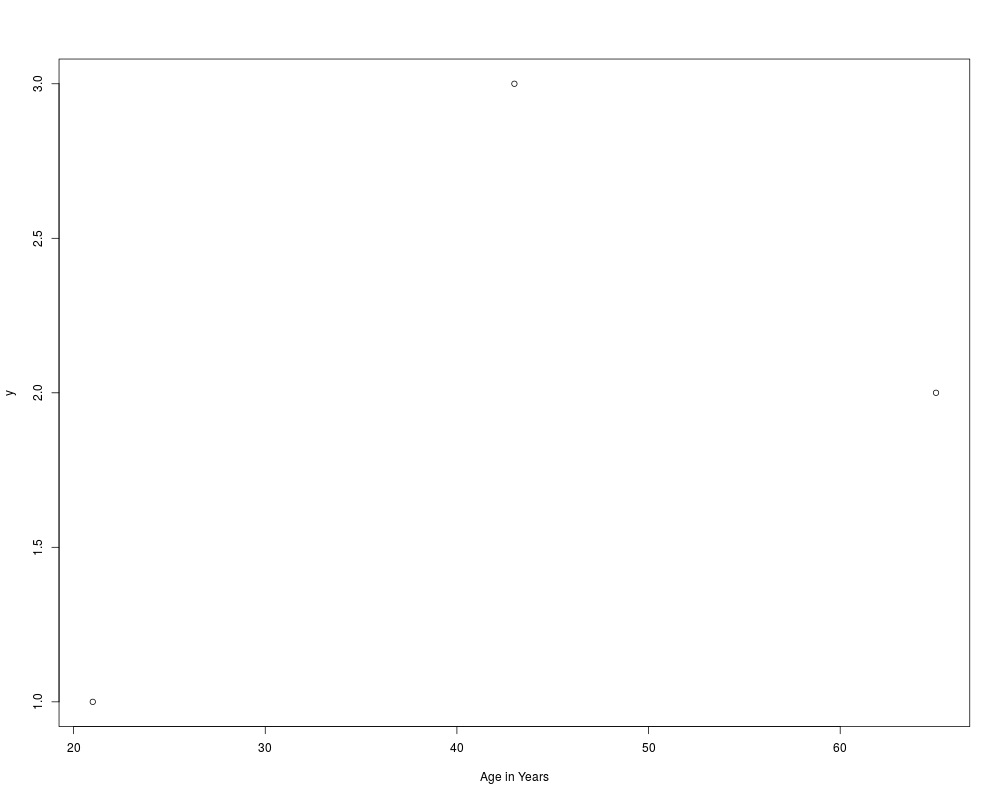
age <- c(21,65,43)
y <- 1:3
label(age) <- "Age in Years"
plot(age, y, xlab=label(age))
data <- data.frame(age=age, y=y)
label(data)
label(data, self=TRUE) <- "A data frame"
label(data, self=TRUE)
x1 <- 1:10
x2 <- 10:1
label(x2) <- 'Label for x2'
units(x2) <- 'mmHg'
x2
x2[1:5]
dframe <- data.frame(x1, x2)
Label(dframe)
labelLatex(x2, hfill=TRUE, bold=TRUE)
labelLatex(label='Velocity', units='m/s')
##In these examples of llist, note that labels are printed after
##variable names, because of print.labelled
a <- 1:3
b <- 4:6
label(b) <- 'B Label'
llist(a,b)
llist(a,b,d=0)
llist(a,b,0)
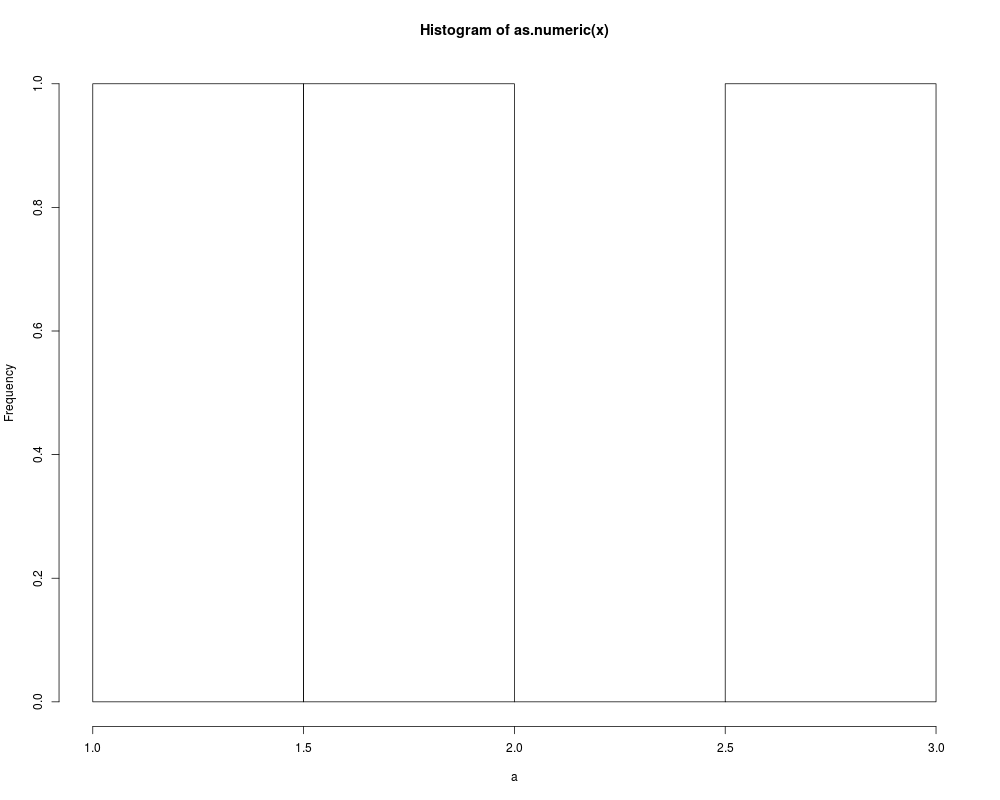
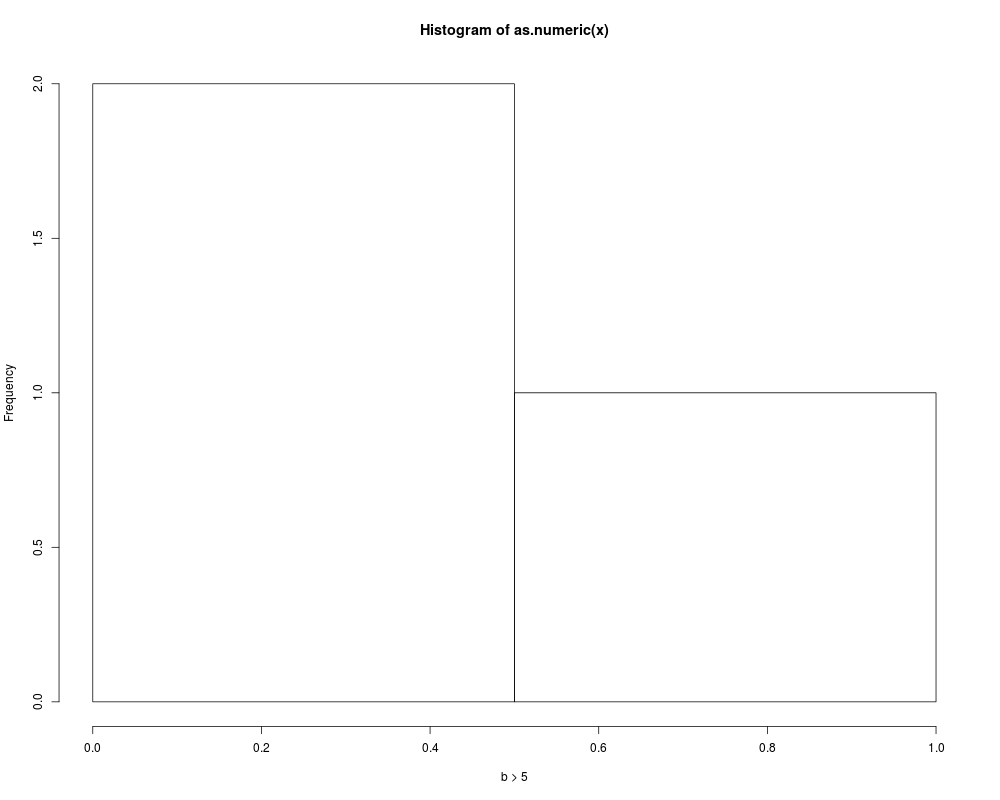
w <- llist(a, b>5, d=101:103)
sapply(w, function(x){
hist(as.numeric(x), xlab=label(x))
# locator(1) ## wait for mouse click
})
# Or: for(u in w) {hist(u); title(label(u))}
Results
R version 3.3.1 (2016-06-21) -- "Bug in Your Hair"
Copyright (C) 2016 The R Foundation for Statistical Computing
Platform: x86_64-pc-linux-gnu (64-bit)

R is free software and comes with ABSOLUTELY NO WARRANTY.
You are welcome to redistribute it under certain conditions.
Type 'license()' or 'licence()' for distribution details.

R is a collaborative project with many contributors.
Type 'contributors()' for more information and
'citation()' on how to cite R or R packages in publications.

Type 'demo()' for some demos, 'help()' for on-line help, or
'help.start()' for an HTML browser interface to help.
Type 'q()' to quit R.

> library(Hmisc)
Loading required package: lattice
Loading required package: survival
Loading required package: Formula
Loading required package: ggplot2

Attaching package: 'Hmisc'

The following objects are masked from 'package:base':

    format.pval, round.POSIXt, trunc.POSIXt, units

> png(filename="/home/ddbj/snapshot/RGM3/R_CC/result/Hmisc/label.Rd_%03d_medium.png", width=480, height=480)
> ### Name: label
> ### Title: Label Attribute of an Object
> ### Aliases: label label<- label.default label.Surv label<-.default
> ###   labelPlotmath labelLatex [.labelled print.labelled Label
> ###   Label.data.frame llist plotmathTranslate as.data.frame.labelled
> ###   data.frame.labelled reLabelled label.data.frame label<-.data.frame
> ###   relevel.labelled combineLabels
> ### Keywords: attribute misc utilities
>
> ### ** Examples
>
> age <- c(21,65,43)
> y   <- 1:3
> label(age) <- "Age in Years"
> plot(age, y, xlab=label(age))
>
> data <- data.frame(age=age, y=y)
> label(data)
           age              y
"Age in Years"             ""
>
> label(data, self=TRUE) <- "A data frame"
> label(data, self=TRUE)
[1] "A data frame"
>
> x1 <- 1:10
> x2 <- 10:1
> label(x2) <- 'Label for x2'
> units(x2) <- 'mmHg'
> x2
Label for x2 [mmHg]
 [1] 10  9  8  7  6  5  4  3  2  1
> x2[1:5]
Label for x2 [mmHg]
[1] 10  9  8  7  6
> dframe <- data.frame(x1, x2)
> Label(dframe)
label(x1)	<- ''
label(x2)	<- 'Label for x2'
>
> labelLatex(x2, hfill=TRUE, bold=TRUE)
[1] "{\textbf Label for x2}\hfill {\smaller[2] mmHg}"
> labelLatex(label='Velocity', units='m/s')
[1] "Velocity {\smaller[2] m/s}"
>
> ##In these examples of llist, note that labels are printed after
> ##variable names, because of print.labelled
> a <- 1:3
> b <- 4:6
> label(b) <- 'B Label'
> llist(a,b)
$a
a
[1] 1 2 3

$b
B Label
[1] 4 5 6

> llist(a,b,d=0)
$a
a
[1] 1 2 3

$b
B Label
[1] 4 5 6

$d
d
[1] 0

> llist(a,b,0)
$a
a
[1] 1 2 3

$b
B Label
[1] 4 5 6

$`0`
0
[1] 0

>
>
> w <- llist(a, b>5, d=101:103)
> sapply(w, function(x){
+   hist(as.numeric(x), xlab=label(x))
+   # locator(1)   ## wait for mouse click
+ })
         a               b > 5           d
breaks   Numeric,5       Numeric,3       Numeric,5
counts   Integer,4       Integer,2       Integer,4
density  Numeric,4       Numeric,2       Numeric,4
mids     Numeric,4       Numeric,2       Numeric,4
xname    "as.numeric(x)" "as.numeric(x)" "as.numeric(x)"
equidist TRUE            TRUE            TRUE
>
> # Or: for(u in w) {hist(u); title(label(u))}
>
>
>
>
>
> dev.off()
null device
          1
>
 .
.