Plots multiple lines based on a vector x and a matrix y,
draws thin vertical lines connecting limits represented by columns of
y beyond the first. It is assumed that either (1) the second
and third columns of y represent lower and upper confidence
limits, or that (2) there is an even number of columns beyond the
first and these represent ascending quantiles that are symmetrically
arranged around 0.5.
a numeric matrix with number of rows equal to the number of
x elements
pos
when pos='left' the vertical lines are drawn, right
to left, to the left of the point (x, y[,1). Otherwise lines
are drawn left to right to the right of the point.
col
a color used to connect (x, y[,1]) pairs. The same
color but with transparency given by the alpha argument is
used to draw the vertical lines
lwd
line width for main lines
lty
line types for main lines
lwd.vert
line width for vertical lines
lty.vert
line type for vertical lines
alpha
transparency
grid
set to TRUE when using grid/lattice
Author(s)
Frank Harrell
Examples
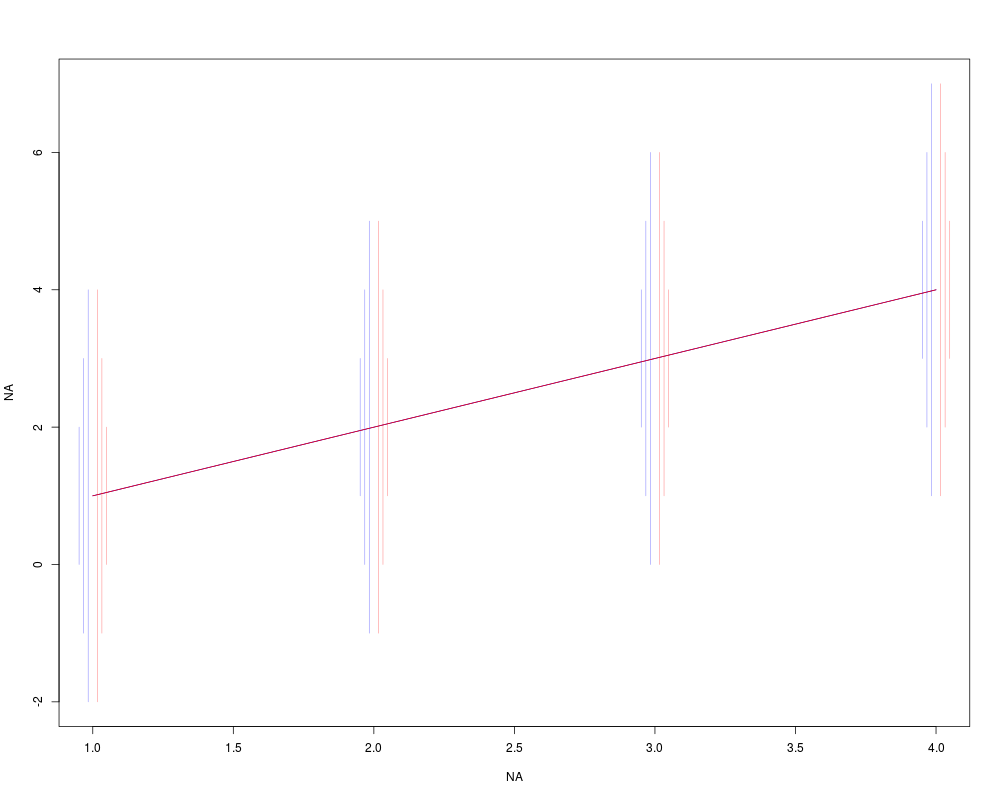
x <- 1:4
y <- cbind(x, x-3, x-2, x-1, x+1, x+2, x+3)
plot(NA, NA, xlim=c(1,4), ylim=c(-2, 7))
multLines(x, y, col='blue')
multLines(x, y, col='red', pos='right')
Results
R version 3.3.1 (2016-06-21) -- "Bug in Your Hair"
Copyright (C) 2016 The R Foundation for Statistical Computing
Platform: x86_64-pc-linux-gnu (64-bit)

R is free software and comes with ABSOLUTELY NO WARRANTY.
You are welcome to redistribute it under certain conditions.
Type 'license()' or 'licence()' for distribution details.

R is a collaborative project with many contributors.
Type 'contributors()' for more information and
'citation()' on how to cite R or R packages in publications.

Type 'demo()' for some demos, 'help()' for on-line help, or
'help.start()' for an HTML browser interface to help.
Type 'q()' to quit R.

> library(Hmisc)
Loading required package: lattice
Loading required package: survival
Loading required package: Formula
Loading required package: ggplot2

Attaching package: 'Hmisc'

The following objects are masked from 'package:base':

    format.pval, round.POSIXt, trunc.POSIXt, units

> png(filename="/home/ddbj/snapshot/RGM3/R_CC/result/Hmisc/multLines.Rd_%03d_medium.png", width=480, height=480)
> ### Name: multLines
> ### Title: Plot Multiple Lines
> ### Aliases: multLines
> ### Keywords: hplot
>
> ### ** Examples
>
> x <- 1:4
> y <- cbind(x, x-3, x-2, x-1, x+1, x+2, x+3)
> plot(NA, NA, xlim=c(1,4), ylim=c(-2, 7))
> multLines(x, y, col='blue')
> multLines(x, y, col='red', pos='right')
>
>
>
>
>
> dev.off()
null device
          1
>
 .
.