Supported by Dr. Osamu Ogasawara and  . . |
|
Last data update: 2014.03.03 |
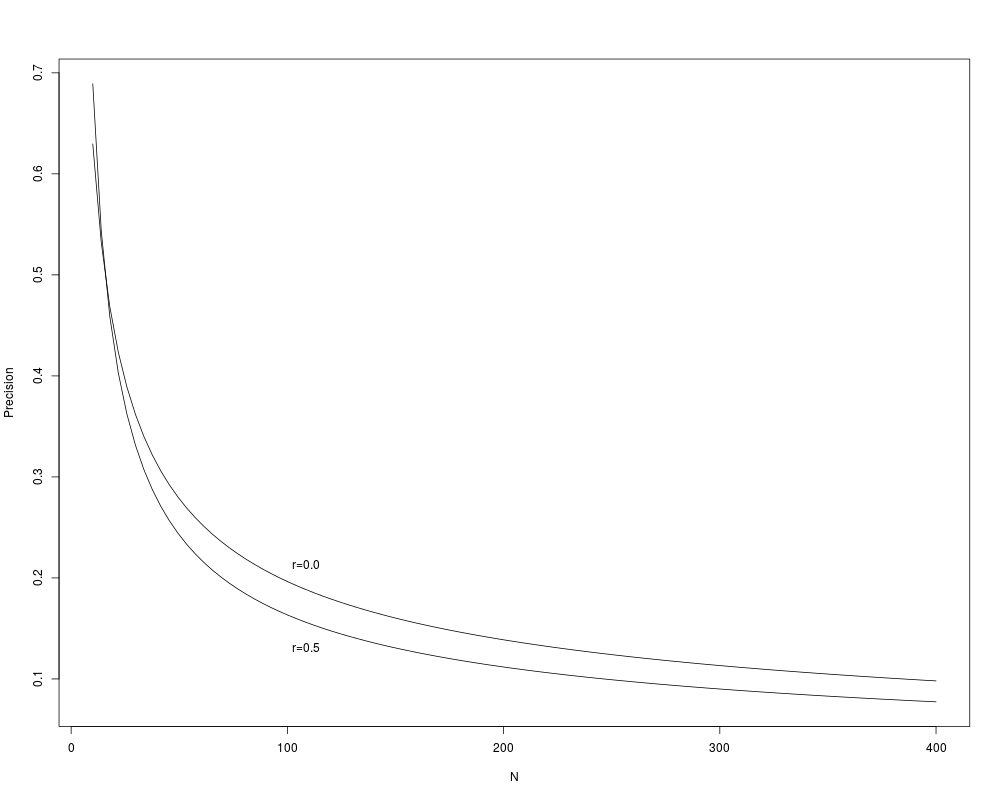
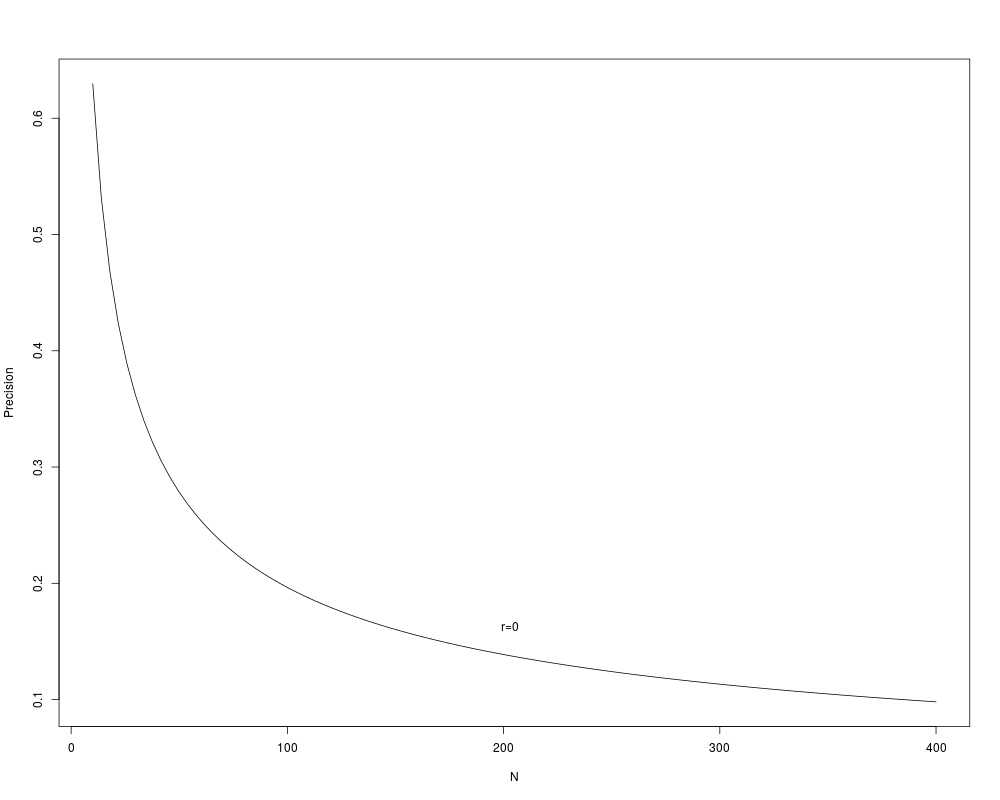
Plot Precision of Estimate of Pearson Correlation CoefficientDescriptionThis function plots the precision (margin of error) of the
product-moment linear
correlation coefficient r vs. sample size, for a given vector of
correlation coefficients Usage
plotCorrPrecision(rho = c(0, 0.5), n = seq(10, 400, length = 100),
                  conf.int = 0.95, offset=0.025, ...)
Arguments
Author(s)Xing Wang and Frank Harrell See Also
ExamplesplotCorrPrecision() plotCorrPrecision(rho=0) Results
R version 3.3.1 (2016-06-21) -- "Bug in Your Hair"
Copyright (C) 2016 The R Foundation for Statistical Computing
Platform: x86_64-pc-linux-gnu (64-bit)

R is free software and comes with ABSOLUTELY NO WARRANTY.
You are welcome to redistribute it under certain conditions.
Type 'license()' or 'licence()' for distribution details.

R is a collaborative project with many contributors.
Type 'contributors()' for more information and
'citation()' on how to cite R or R packages in publications.

Type 'demo()' for some demos, 'help()' for on-line help, or
'help.start()' for an HTML browser interface to help.
Type 'q()' to quit R.

> library(Hmisc)
Loading required package: lattice
Loading required package: survival
Loading required package: Formula
Loading required package: ggplot2

Attaching package: 'Hmisc'

The following objects are masked from 'package:base':

    format.pval, round.POSIXt, trunc.POSIXt, units

> png(filename="/home/ddbj/snapshot/RGM3/R_CC/result/Hmisc/plotCorrPrecision.Rd_%03d_medium.png", width=480, height=480)
> ### Name: plotCorrPrecision
> ### Title: Plot Precision of Estimate of Pearson Correlation Coefficient
> ### Aliases: plotCorrPrecision
> ### Keywords: htest
>
> ### ** Examples
>
> plotCorrPrecision()
> plotCorrPrecision(rho=0)
>
>
>
>
>
> dev.off()
null device
          1
>
|
Created & Maintained by Osamu Ogasawara (osamu.ogasawara@gmail.com) and 