Supported by Dr. Osamu Ogasawara and  . . |
|
Last data update: 2014.03.03 |
Concentration CurveDescriptionPlots a concentration curve. UsagecurveConcent(x, y, w = NULL, xlab = NA, ylab = NA, add = FALSE, grid = 0, ...) Arguments
ReferencesO'Donnell O., van Doorslaer E., Wagstaff A., Lindelow M. (2008) Analyzing Health Equity Using Household Survey Data. World Bank, 220 p. See Also
Examples
data(hhbudgets)
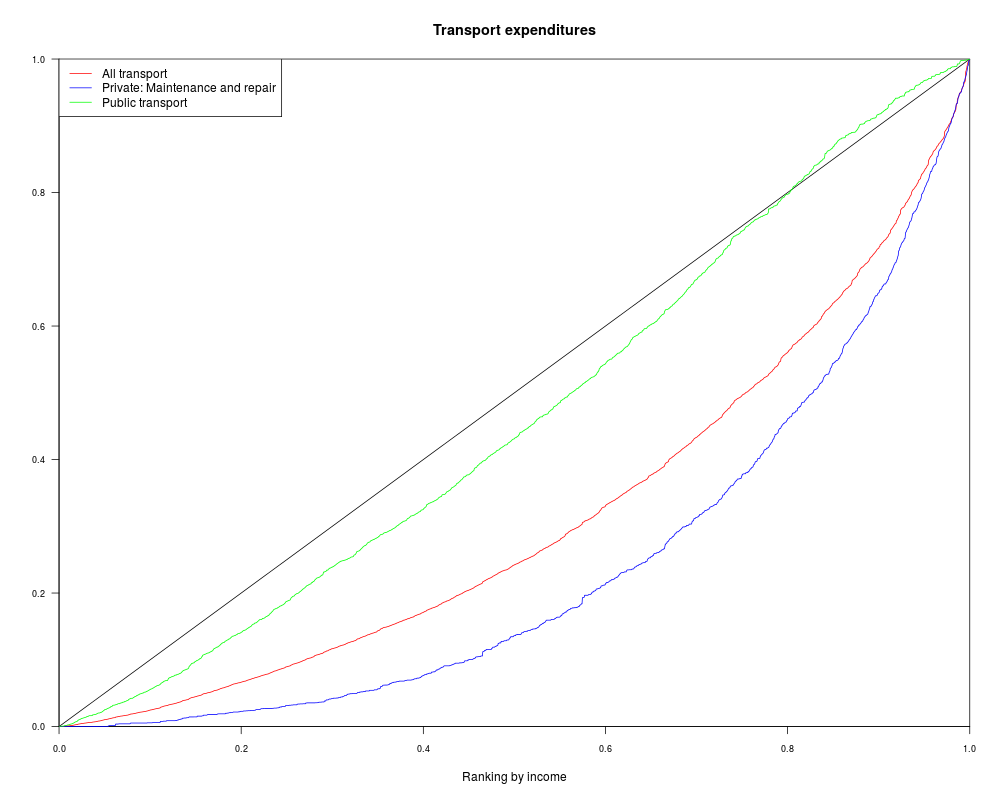
curveConcent(x=hhbudgets[, "transporte"], y=hhbudgets[,"ingreso"], w=hhbudgets[,"factor"], col="red", xlab="Ranking by income")
curveConcent(x=hhbudgets[, "mantenimiento"], y=hhbudgets[,"ingreso"], w=hhbudgets[,"factor"], col="blue", add=TRUE)
curveConcent(x=hhbudgets[, "publico"], y=hhbudgets[,"ingreso"], w=hhbudgets[,"factor"], col="green", add=TRUE)
title(main="Transport expenditures")
legend("topleft", legend = c("All transport", "Private: Maintenance and repair", "Public transport"), col=c("red", "blue", "green"), lty=rep(1, 3))
Results
R version 3.3.1 (2016-06-21) -- "Bug in Your Hair"
Copyright (C) 2016 The R Foundation for Statistical Computing
Platform: x86_64-pc-linux-gnu (64-bit)

R is free software and comes with ABSOLUTELY NO WARRANTY.
You are welcome to redistribute it under certain conditions.
Type 'license()' or 'licence()' for distribution details.

R is a collaborative project with many contributors.
Type 'contributors()' for more information and
'citation()' on how to cite R or R packages in publications.

Type 'demo()' for some demos, 'help()' for on-line help, or
'help.start()' for an HTML browser interface to help.
Type 'q()' to quit R.

> library(IC2)
> png(filename="/home/ddbj/snapshot/RGM3/R_CC/result/IC2/curveConcent.Rd_%03d_medium.png", width=480, height=480)
> ### Name: curveConcent
> ### Title: Concentration Curve
> ### Aliases: curveConcent
>
> ### ** Examples
>
> data(hhbudgets)
>
> curveConcent(x=hhbudgets[, "transporte"], y=hhbudgets[,"ingreso"], w=hhbudgets[,"factor"], col="red", xlab="Ranking by income")
> curveConcent(x=hhbudgets[, "mantenimiento"], y=hhbudgets[,"ingreso"], w=hhbudgets[,"factor"], col="blue", add=TRUE)
> curveConcent(x=hhbudgets[, "publico"], y=hhbudgets[,"ingreso"], w=hhbudgets[,"factor"], col="green", add=TRUE)
> title(main="Transport expenditures")
> legend("topleft", legend = c("All transport", "Private: Maintenance and repair", "Public transport"), col=c("red", "blue", "green"), lty=rep(1, 3))
>
>
>
>
>
> dev.off()
null device
          1
>
|
Created & Maintained by Osamu Ogasawara (osamu.ogasawara@gmail.com) and 