Supported by Dr. Osamu Ogasawara and  . . |
|
Last data update: 2014.03.03 |
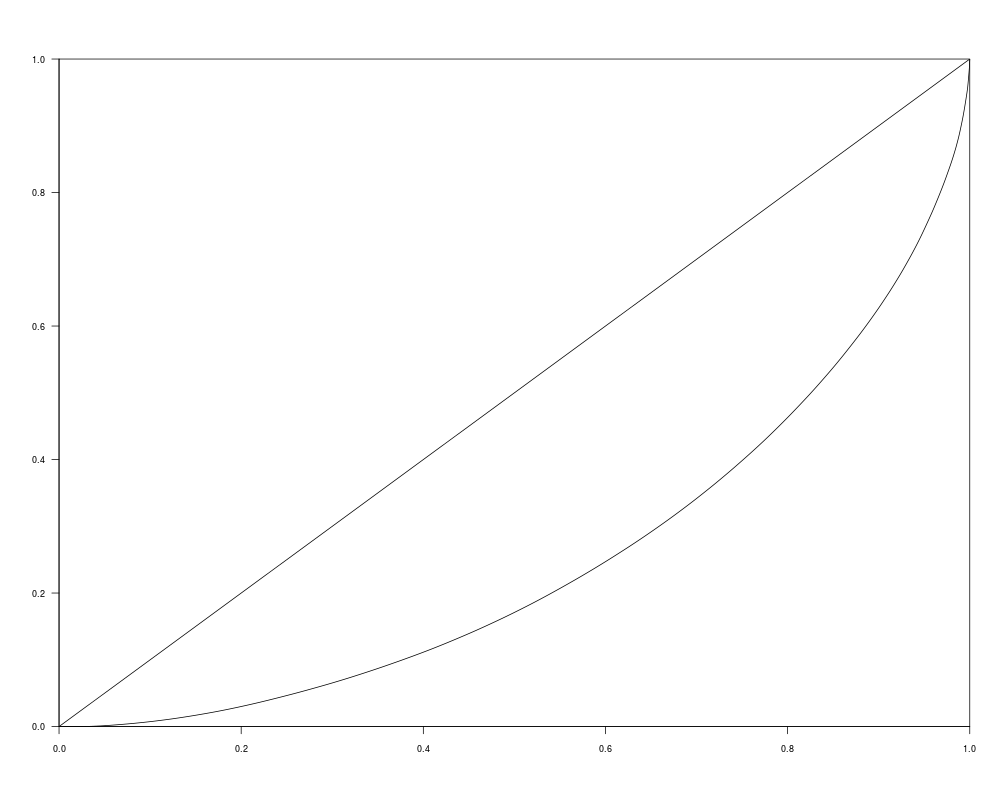
Lorenz CurveDescriptionPlots an ordinary or generalized Lorenz curve. UsagecurveLorenz(x, w = NULL, gener = FALSE, xlab = NA, ylab = NA, add = FALSE, grid = 0, ...) Arguments
ReferencesCowell F.A. (2000) Measurement of Inequality. In Atkinson A.B., Bourguignon F. (Eds.) Handbook of Income Distribution. Amsterdam, Elsevier, Vol. 1, pp. 87-166. See Also
Examplesdata(hhbudgets) curveLorenz(x=hhbudgets[, "transporte"], w =hhbudgets[,"factor"]) curveLorenz(x=hhbudgets[, "transporte"], w =hhbudgets[,"factor"], gener=TRUE, col="red") Results
R version 3.3.1 (2016-06-21) -- "Bug in Your Hair"
Copyright (C) 2016 The R Foundation for Statistical Computing
Platform: x86_64-pc-linux-gnu (64-bit)

R is free software and comes with ABSOLUTELY NO WARRANTY.
You are welcome to redistribute it under certain conditions.
Type 'license()' or 'licence()' for distribution details.

R is a collaborative project with many contributors.
Type 'contributors()' for more information and
'citation()' on how to cite R or R packages in publications.

Type 'demo()' for some demos, 'help()' for on-line help, or
'help.start()' for an HTML browser interface to help.
Type 'q()' to quit R.

> library(IC2)
> png(filename="/home/ddbj/snapshot/RGM3/R_CC/result/IC2/curveLorenz.Rd_%03d_medium.png", width=480, height=480)
> ### Name: curveLorenz
> ### Title: Lorenz Curve
> ### Aliases: curveLorenz
>
> ### ** Examples
>
> data(hhbudgets)
>
> curveLorenz(x=hhbudgets[, "transporte"], w =hhbudgets[,"factor"])
> curveLorenz(x=hhbudgets[, "transporte"], w =hhbudgets[,"factor"], gener=TRUE, col="red")
>
>
>
>
>
> dev.off()
null device
          1
>
|

Created & Maintained by Osamu Ogasawara (osamu.ogasawara@gmail.com) and 