Supported by Dr. Osamu Ogasawara and  . . |
|
Last data update: 2014.03.03 |
Methods for ICA objects.DescriptionProvide standard methods for manipulating ICA objects, namely printing, plotting, summarising and extracting the position of the minimum. Usage
## S3 method for class 'ICA'
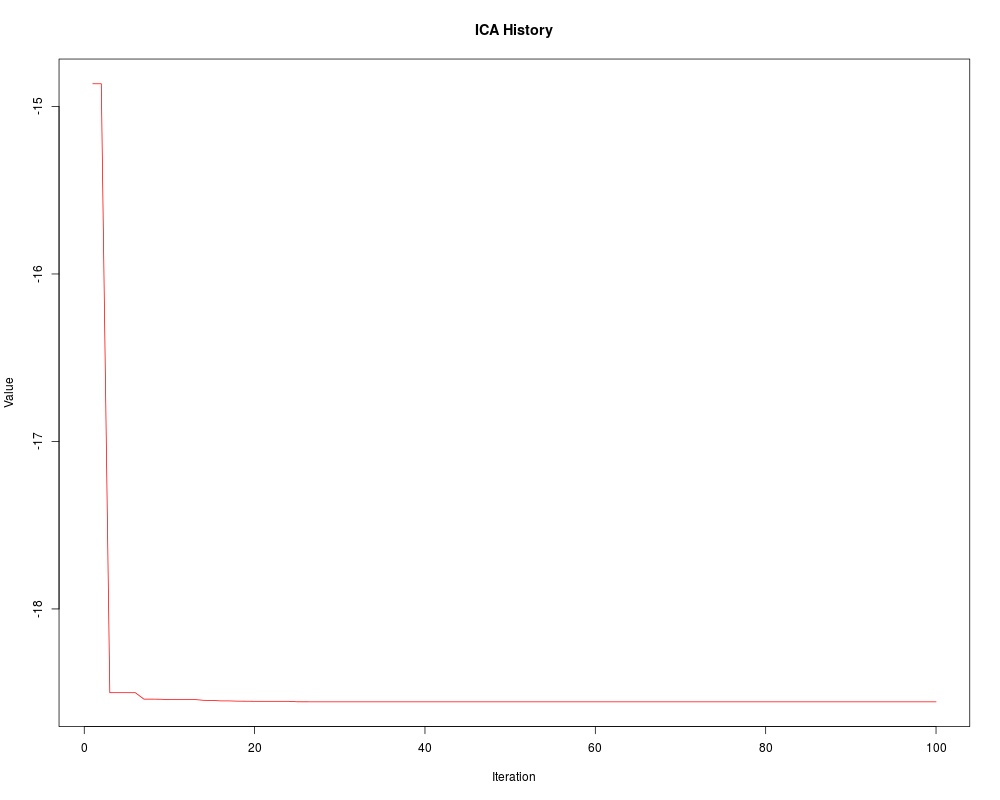
plot(x, ..., xlab = "Iteration", ylab = "Value",
main = "ICA History", col = "red")
## S3 method for class 'ICA'
print(x, ...)
## S3 method for class 'ICA'
summary(object, ...)
## S3 method for class 'ICA'
coef(object, ...)
Arguments
DetailsMethods for standard generic functions when dealing with objects of
class Value
Examples
## --------cost function: f(x,y) = x * sin(4 * x) + 1.1 * y * sin(2 * y)
## --------search region: -10 <= x, y <= 10

cost <- function(x) {
  x[1] * sin(4 * x[1]) + 1.1 * x[2] * sin(2 * x[2])
}

ICAout <- ICA(cost, nvar = 2, ncountries = 80, nimp = 10,
              maxiter = 100, lb = -10, ub = 10,
              beta = 2, P_revolve = 0.3, zeta = 0.02)

summary(ICAout)     ## same as the print method
coef(ICAout)        ## get the position of the minimum
cost(coef(ICAout))  ## cost at the minimum
plot(ICAout)        ## show the history of the process
Results
R version 3.3.1 (2016-06-21) -- "Bug in Your Hair"
Copyright (C) 2016 The R Foundation for Statistical Computing
Platform: x86_64-pc-linux-gnu (64-bit)

R is free software and comes with ABSOLUTELY NO WARRANTY.
You are welcome to redistribute it under certain conditions.
Type 'license()' or 'licence()' for distribution details.

R is a collaborative project with many contributors.
Type 'contributors()' for more information and
'citation()' on how to cite R or R packages in publications.

Type 'demo()' for some demos, 'help()' for on-line help, or
'help.start()' for an HTML browser interface to help.
Type 'q()' to quit R.

> library(ICAFF)
> png(filename="/home/ddbj/snapshot/RGM3/R_CC/result/ICAFF/plot.ICA.Rd_%03d_medium.png", width=480, height=480)
> ### Name: plot.ICA
> ### Title: Methods for ICA objects.
> ### Aliases: plot.ICA print.ICA summary.ICA coef.ICA
> ### Keywords: optimize
>
> ### ** Examples
>
>
> ## --------cost function: f(x,y) = x * sin(4 * x) + 1.1 * y * sin(2 * y)
> ## --------search region: -10 <= x, y <= 10
>
> cost <- function(x) {
+   x[1] * sin(4 * x[1]) + 1.1 * x[2] * sin(2 * x[2])
+ }
>
> ICAout <- ICA(cost, nvar = 2, ncountries = 80, nimp = 10,
+               maxiter = 100, lb = -10, ub = 10,
+               beta = 2, P_revolve = 0.3, zeta = 0.02)
>
> summary(ICAout)     ## same as the print method
 Call:
ICA(cost = cost, nvar = 2, ncountries = 80, nimp = 10, maxiter = 100,
    lb = -10, ub = 10, beta = 2, P_revolve = 0.3, zeta = 0.02)

 Best solution:  -9.038992 8.668182
 Best value:  -18.55472
 No. of Imperialists:  1
 Timings:
   user  system elapsed
  0.564   0.000   0.570
> coef(ICAout)        ## get the position of the minimum
[1] -9.038992  8.668182
> cost(coef(ICAout))  ## cost at the minimum
[1] -18.55472
> plot(ICAout)        ## show the history of the process
>
>
>
>
>
>
> dev.off()
null device
          1
>
|
Created & Maintained by Osamu Ogasawara (osamu.ogasawara@gmail.com) and 