Supported by Dr. Osamu Ogasawara and  . . |
|
Last data update: 2014.03.03 |
Compute Preference Colors for Outcomes in a Bootstrap ICE Scatter within a Confidence WedgeDescriptionAssuming ICEw is an object of class ICEwedge, ICEcolor uses the value of lambda given by lfact * (ICEw item lambda) and the ICE Preference Map with parameters beta and gamma to compute the Economic Preference value for only the points in a Bootstrap Distribution of ICE Uncertainty that also happen to fall within the ICE confidence wedge. When the overall level of confidence (statistical size of the wedge) is held fixed, the points to be colored are always the very same points for all choices of lambda. However, the numerical value of preference (and thus the color) for each such point as well as potential overall asymmetry in the resulting ICE map do depend greatly upon choice of lambda. UsageICEcolor(ICEw, lfact = 1, beta = 1, gamma = 3+2*sqrt(2)) Arguments
DetailsMultiple calls to ICEcolor() are usually made for different lfact multipliers of the lambda item within ICEw as well as different choices for the ICE Preference power parameters, beta and gamma. Calls to plot(x, alibi) for these alternative ICEcolor x-objects can be used to illustrate that exogenous Economic Uncertainty can literally SWAMP the Statistical Uncertainty endogenous to patient level data on the relative cost and effectiveness of two treatments. ValueObject of class ICEcolor containing an output list with the following items:
Author(s)Bob Obenchain <wizbob@att.net> ReferencesCook JR, Heyse JF. Use of an angular transformation for ratio estimation in cost-effectiveness analysis. Statistics in Medicine 2000; 19: 2989-3003. Obenchain RL. ICE Preference Maps: Nonlinear Generalizations of Net Benefit and Acceptability. Health Serv Outcomes Res Method 2008; 8: 31-56. DOI 10.1007/s10742-007-0027-2. Open Access. Obenchain RL. ICEinR.pdf Vignette-like documentation for ICEinfer stored in the R library/ICEinfer/doc folder. 2009; 30 pages. See Also
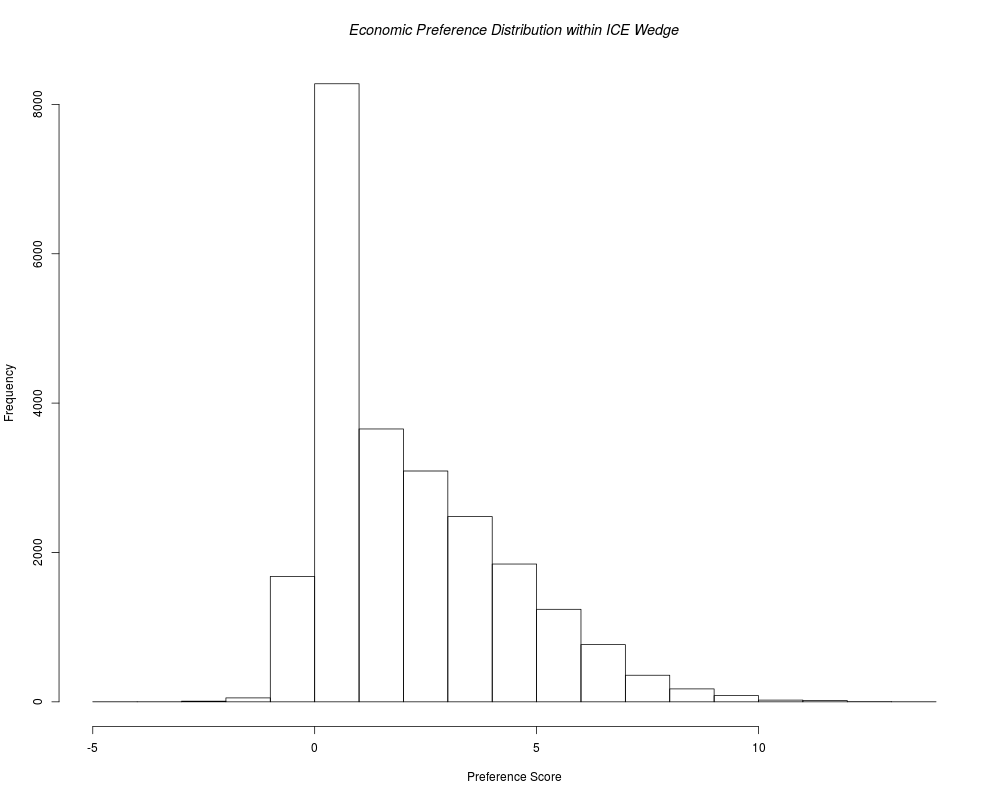
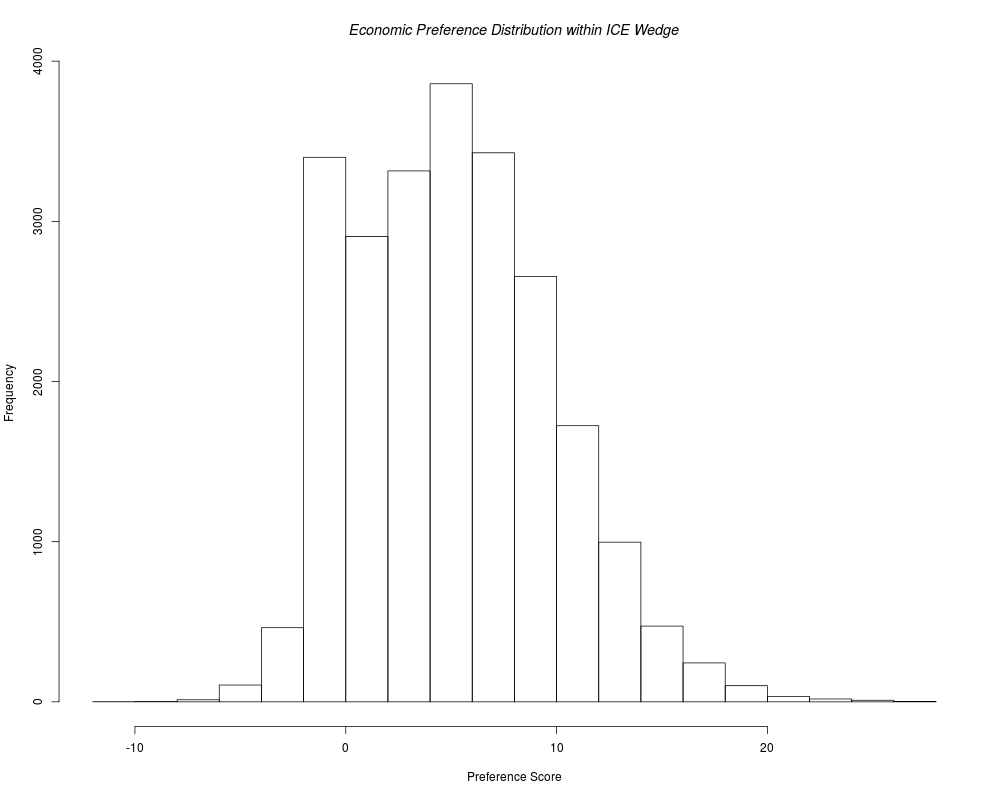
Examples# Read in previously computed ICEwedge output list. data(dpwdg) dpcol <- ICEcolor(dpwdg) # Display preference coloring for the stored value of lambda. plot(dpcol) dpcolX <- ICEcolor(dpwdg, lfact=10) # Display preference coloring when lambda is increased by a factor of 10. plot(dpcolX) Results
R version 3.3.1 (2016-06-21) -- "Bug in Your Hair"
Copyright (C) 2016 The R Foundation for Statistical Computing
Platform: x86_64-pc-linux-gnu (64-bit)

R is free software and comes with ABSOLUTELY NO WARRANTY.
You are welcome to redistribute it under certain conditions.
Type 'license()' or 'licence()' for distribution details.

R is a collaborative project with many contributors.
Type 'contributors()' for more information and
'citation()' on how to cite R or R packages in publications.

Type 'demo()' for some demos, 'help()' for on-line help, or
'help.start()' for an HTML browser interface to help.
Type 'q()' to quit R.

> library(ICEinfer)
Loading required package: lattice
> png(filename="/home/ddbj/snapshot/RGM3/R_CC/result/ICEinfer/ICEcolor.Rd_%03d_medium.png", width=480, height=480)
> ### Name: ICEcolor
> ### Title: Compute Preference Colors for Outcomes in a Bootstrap ICE
> ###   Scatter within a Confidence Wedge
> ### Aliases: ICEcolor
> ### Keywords: methods
>
> ### ** Examples
>
>   # Read in previously computed ICEwedge output list.
>   data(dpwdg)
>   dpcol <- ICEcolor(dpwdg)
>   # Display preference coloring for the stored value of lambda.
>   plot(dpcol)
>   dpcolX <- ICEcolor(dpwdg, lfact=10)
>   # Display preference coloring when lambda is increased by a factor of 10.
>   plot(dpcolX)
>
>
>
>
>
> dev.off()
null device
          1
>
|