Supported by Dr. Osamu Ogasawara and  . . |
|
Last data update: 2014.03.03 |
INCA indexDescription
UsageINCAindex(d, pert_clus) Arguments
ValueReturns an object of class
NoteFor a correct geometrical interpretation it is convenient to verify whether the distance matrix d is Euclidean. It admits the associated methods summary and plot. The first simply returns the percentage of well-classified units and the second offers a barchart with the percentages of well classified units for each group in the given partition. Author(s)Itziar Irigoien itziar.irigoien@ehu.es; Konputazio Zientziak eta Adimen Artifiziala, Euskal Herriko Unibertsitatea (UPV-EHU), Donostia, Spain. Conchita Arenas carenas@ub.edu; Departament d'Estadistica, Universitat de Barcelona, Barcelona, Spain. ReferencesArenas, C. and Cuadras, C.M. (2002). Some recent statistical methods based on distances. Contributions to Science, 2, 183–191. Irigoien, I. and Arenas, C. (2008). INCA: New statistic for estimating the number of clusters and identifying atypical units. Statistics in Medicine, 27(15), 2948–2973. See Also
Examples
#generate 3 clusters, each of them with 20 objects in dimension 5.
mu1 <- sample(1:10, 5, replace=TRUE)
x1 <- matrix(rnorm(20*5, mean = mu1, sd = 1),ncol=5, byrow=TRUE)
mu2 <- sample(1:10, 5, replace=TRUE)
x2 <- matrix(rnorm(20*5, mean = mu2, sd = 1),ncol=5, byrow=TRUE)
mu3 <- sample(1:10, 5, replace=TRUE)
x3 <- matrix(rnorm(20*5, mean = mu3, sd = 1),ncol=5, byrow=TRUE)
x <- rbind(x1,x2,x3)
# Euclidean distance between units.
d <- dist(x)
# given the right partition, calculate the percentage of well classified objects.
partition <- c(rep(1,20), rep(2,20), rep(3,20))
INCAindex(d, partition)
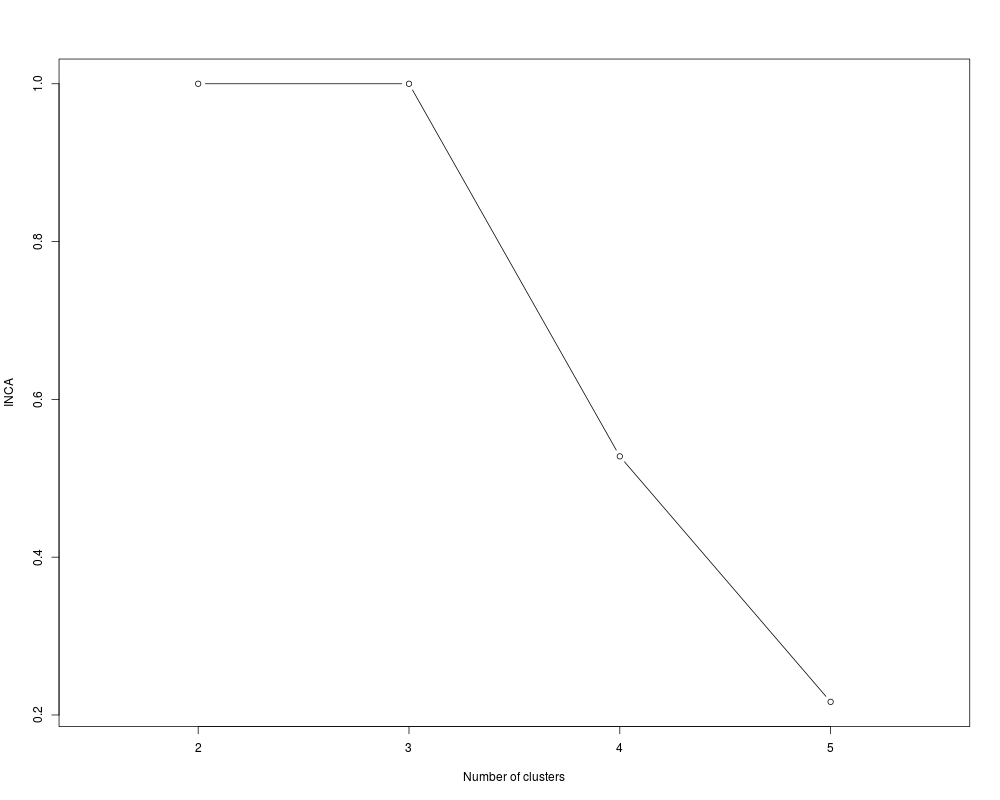
# In order to estimate the number of cluster in data, try several
# partitions and compare the results
library(cluster)
T <- rep(NA, 5)
for (l in 2:5){
part <- pam(d,l)$clustering
T[l] <- INCAindex(d,part)$Total
}
plot(T, type="b",xlab="Number of clusters", ylab="INCA", xlim=c(1.5, 5.5))
Results
R version 3.3.1 (2016-06-21) -- "Bug in Your Hair"
Copyright (C) 2016 The R Foundation for Statistical Computing
Platform: x86_64-pc-linux-gnu (64-bit)

R is free software and comes with ABSOLUTELY NO WARRANTY.
You are welcome to redistribute it under certain conditions.
Type 'license()' or 'licence()' for distribution details.

R is a collaborative project with many contributors.
Type 'contributors()' for more information and
'citation()' on how to cite R or R packages in publications.

Type 'demo()' for some demos, 'help()' for on-line help, or
'help.start()' for an HTML browser interface to help.
Type 'q()' to quit R.

> library(ICGE)
Loading required package: MASS
Loading required package: cluster
> png(filename="/home/ddbj/snapshot/RGM3/R_CC/result/ICGE/INCAindex.Rd_%03d_medium.png", width=480, height=480)
> ### Name: INCAindex
> ### Title: INCA index
> ### Aliases: INCAindex print.incaix summary.incaix plot.incaix
> ### Keywords: multivariate cluster
>
> ### ** Examples
>
> #generate 3 clusters, each of them with 20 objects in dimension 5.
> mu1 <- sample(1:10, 5, replace=TRUE)
> x1 <- matrix(rnorm(20*5, mean = mu1, sd = 1),ncol=5, byrow=TRUE)
> mu2 <- sample(1:10, 5, replace=TRUE)
> x2 <- matrix(rnorm(20*5, mean = mu2, sd = 1),ncol=5, byrow=TRUE)
> mu3 <- sample(1:10, 5, replace=TRUE)
> x3 <- matrix(rnorm(20*5, mean = mu3, sd = 1),ncol=5, byrow=TRUE)
> x <- rbind(x1,x2,x3)
>
> # Euclidean distance between units.
> d <- dist(x)
>
> # given the right partition, calculate the percentage of well classified objects.
> partition <- c(rep(1,20), rep(2,20), rep(3,20))
> INCAindex(d, partition)

 ---INCA index---

      number    well       %
Group units   classified  well class.
  1      20      20        1
  2      20      20        1
  3      20      20        1

 INCA index : 1
 ---------------------------------------------
>
>
> # In order to estimate the number of cluster in data, try several
> #  partitions and compare the results
> library(cluster)
> T <- rep(NA, 5)
> for (l in 2:5){
+ 	part <- pam(d,l)$clustering
+ 	T[l] <- INCAindex(d,part)$Total
+ }
>
> plot(T, type="b",xlab="Number of clusters", ylab="INCA", xlim=c(1.5, 5.5))
>
>
>
>
>
> dev.off()
null device
          1
>
|