Supported by Dr. Osamu Ogasawara and  . . |
|
Last data update: 2014.03.03 |
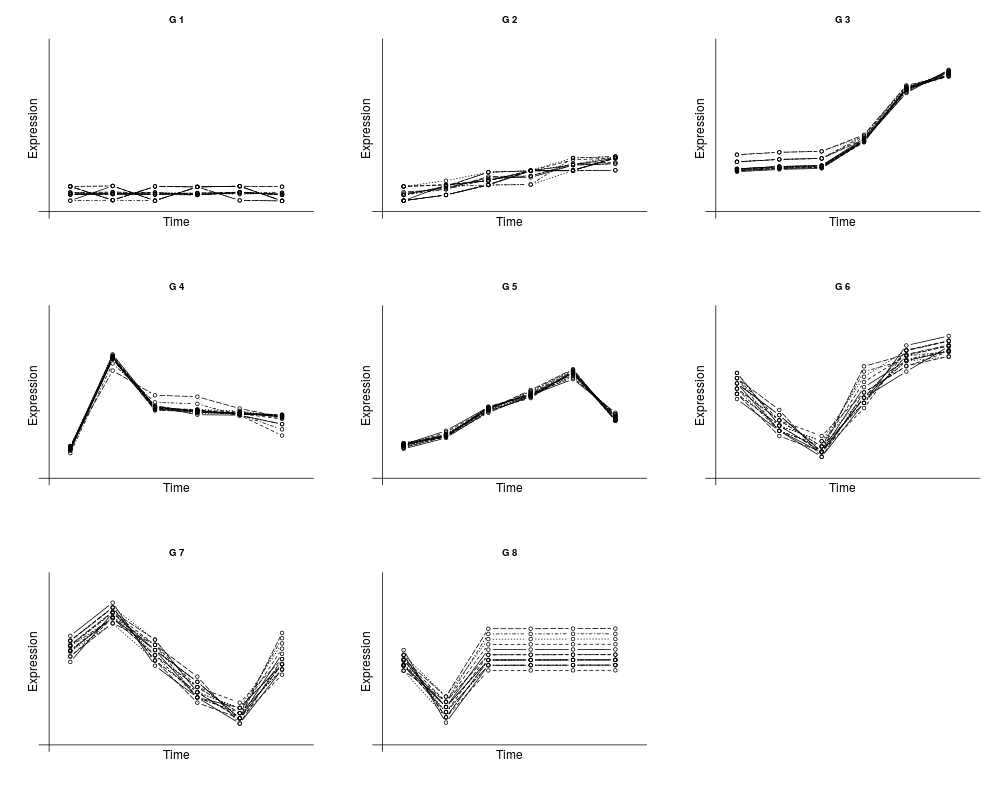
Synthetic Time Course dataDescriptionSythetic time course data where 210 genes profiles along 6 time points are reported and where the genes are drawn from 8 different populations. Usagedata(SyntheticTimeCourse) FormatData frame with 120 rows and 7 columns. DetailsAttribute information: Column cl: the class that the gen belongs to. Columns t1 - t6: gene's expression along the t1, ..., t6 time points considered. Examples
data(SyntheticTimeCourse)
x <- SyntheticTimeCourse[, 2:7]
cl <- SyntheticTimeCourse[, 1]
par(mfrow=c(3,3))
for (g in 1:8){
   xx <- t(x[cl==g,] )
   yy <- matrix(c(1:6 ), nrow=6, ncol=15, byrow=FALSE)
   matplot(yy,xx,  pch=21, type="b", axes=FALSE,
        ylim=c(0,3.5), xlim=c(0.5,6.5), xlab="", ylab="", col="black", main=paste("G",g))
   abline(h=0)
   abline(v=0.5)
   mtext("Time", side=1)
   mtext("Expression", side=2)
}
Results
R version 3.3.1 (2016-06-21) -- "Bug in Your Hair"
Copyright (C) 2016 The R Foundation for Statistical Computing
Platform: x86_64-pc-linux-gnu (64-bit)

R is free software and comes with ABSOLUTELY NO WARRANTY.
You are welcome to redistribute it under certain conditions.
Type 'license()' or 'licence()' for distribution details.

R is a collaborative project with many contributors.
Type 'contributors()' for more information and
'citation()' on how to cite R or R packages in publications.

Type 'demo()' for some demos, 'help()' for on-line help, or
'help.start()' for an HTML browser interface to help.
Type 'q()' to quit R.

> library(ICGE)
Loading required package: MASS
Loading required package: cluster
> png(filename="/home/ddbj/snapshot/RGM3/R_CC/result/ICGE/SyntheticTimeCourse.Rd_%03d_medium.png", width=480, height=480)
> ### Name: SyntheticTimeCourse
> ### Title: Synthetic Time Course data
> ### Aliases: SyntheticTimeCourse
> ### Keywords: datasets
>
> ### ** Examples
>
> data(SyntheticTimeCourse)
> x <- SyntheticTimeCourse[, 2:7]
> cl <- SyntheticTimeCourse[, 1]
> par(mfrow=c(3,3))
> for (g in 1:8){
+    xx <- t(x[cl==g,] )
+    yy <- matrix(c(1:6 ), nrow=6, ncol=15, byrow=FALSE)
+    matplot(yy,xx,  pch=21, type="b", axes=FALSE,
+         ylim=c(0,3.5), xlim=c(0.5,6.5), xlab="", ylab="", col="black", main=paste("G",g))
+    abline(h=0)
+    abline(v=0.5)
+    mtext("Time", side=1)
+    mtext("Expression", side=2)
+ }
>
>
>
>
>
> dev.off()
null device
          1
>
|
Created & Maintained by Osamu Ogasawara (osamu.ogasawara@gmail.com) and 