R: The Main Function to Fit the GORH Model with Interval...
GORH
R Documentation
The Main Function to Fit the GORH Model with Interval Censored Data.
Description
The Generalized Odds Rate Hazards model is fitted for interval censored survival data. The EM algorithm facilitated
by a gamma-poisson data augmentation is applied for estimating the coefficients in the model. The covariance matrix
has closed forms based on the Louis method.
Usage
GORH(formula = formula(data), data = parent.frame(), r = 1, n.int = 5, order = 3,
max.iter = 100, cov.rate = 0.001)
Arguments
formula
The formula for the GORH model, defined using the Surv() function.
data
The interval censored sorvival data, including the left and right end points of the time intervals and the covariates.
If a subject is left(right) censored, the left(right) end point of the subject should be defined as “NA", see example.
r
The transformation parameter in the GORH model, should be greater than 0. The default is r=1 (the PO model).
n.int
Number of equally spaced interior knots of the splines. Default is 5.
order
Order of the spline basis functions. Default is 3, i.e. the cubic splines.
max.iter
The maximum number of interations for the EM algorithm. Default is 100.
cov.rate
The bound for convergence of the algorithm, which defined as the difference between the log-likelihood values of two
consecutive iterations smaller than this value. Default is 0.001.
Details
The formula defined for “formula" is based on the Surv() function, where the left and right end points of the time interval
are included and the type is equal to “interval2". The left(right) end points of left(right) censored individuals should
be defined as “NA" in the data frame before running the function.
The transformation parameter r is a positive number corresponding to a specific model in the GORH family of models.
The special case POMC model(r=1) is set as the default. Other positive numbers can also be specified.
The result for a PH model can be approximated by specifying an extremely small number for r, e.g. r=1e-6.
The grid search method is suggested to find the best model in practice. That is, try a sequence of r values and choose
the one with the greatest log-likelihood value.
Value
ParEst
A list includes the estimated coefficients (Beta,gl), the whole hessian matrix (Hessian), AIC, and the
log-likelihood value(loglik).
ParVcov
The estimated covariance matrix of the coefficient Beta.
Note
The estimated hessian matrix can be very large and sometimes not invertable. In which case, we try the QR decomposition,
g-inverse or even numerical methods to get the covariance matrix. Different values of hess in the ParVcov indicating the
different cases.
hess=0:the hessian matrix is invertable;
hess=1:the QR decomposition is applied to solve the hessian matrix;
hess=2:the g-inverce is applied to the hessian matrix;
hess=3:the hessian matrix is obtained from numerical methods.
The variance estimates may be unreliable for the cases when hess>0.
References
Zhou, J., Zhang, J. and Lu, W. (2016+). On Encient Estimation of Generalized Odds-Rate Models with Interval
Censored Data. Submitted to Biometrics.
Examples
data(Hemophilia)
# Set Left/Right Interval End Points as NA
Hemophilia$L[Hemophilia$d1==1]<-Hemophilia$R[Hemophilia$d3==1]<-NA
# Fit PO Model (r=1)
fit<-GORH(Surv(L,R)~Low+Medium+High,data=Hemophilia,r=1)
summary(fit)
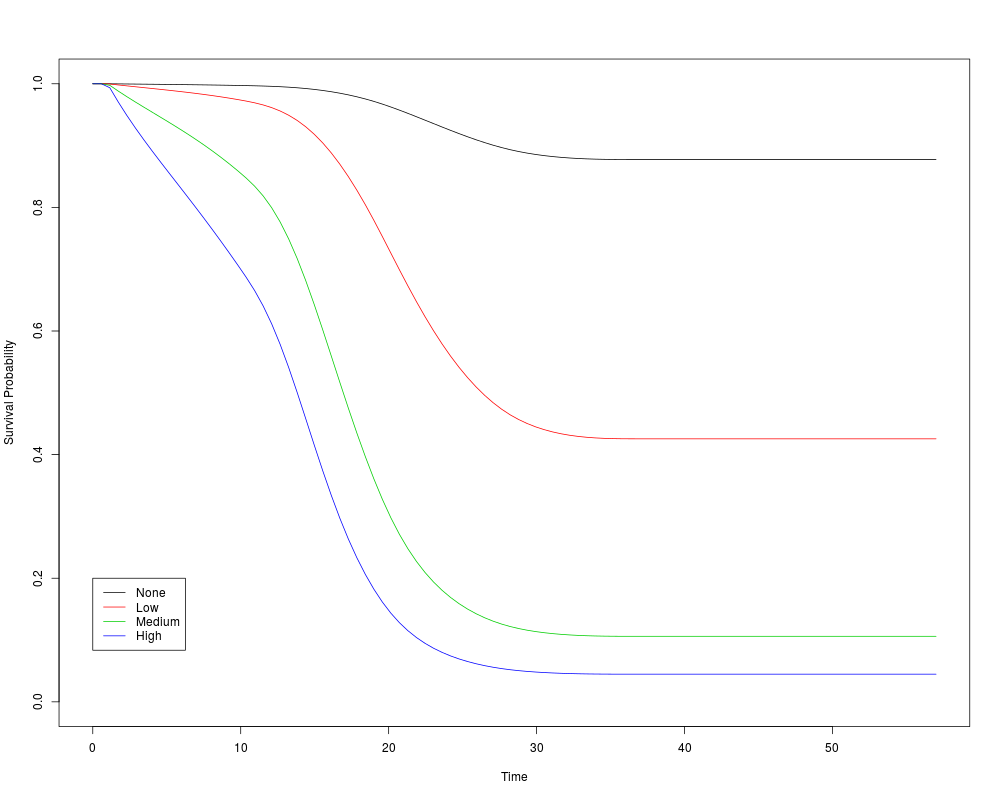
# Predict Survival Curve for a New Individual
# Specify coveriate vectors for new.x
pred1<-predict(fit,new.x=c(0,0,0))
pred2<-predict(fit,new.x=c(1,0,0))
pred3<-predict(fit,new.x=c(0,1,0))
pred4<-predict(fit,new.x=c(0,0,1))
# Plot the Survival Curves
plot(pred1,xlab="Time",ylab="Survival Probability",ylim=c(0,1))
lines(pred2$SurvTime,pred2$SurvProb,col=2)
lines(pred3$SurvTime,pred3$SurvProb,col=3)
lines(pred4$SurvTime,pred4$SurvProb,col=4)
legend(0,0.2,c("None","Low","Medium","High"),lty=1,col=1:4)
Results
R version 3.3.1 (2016-06-21) -- "Bug in Your Hair"
Copyright (C) 2016 The R Foundation for Statistical Computing
Platform: x86_64-pc-linux-gnu (64-bit)

R is free software and comes with ABSOLUTELY NO WARRANTY.
You are welcome to redistribute it under certain conditions.
Type 'license()' or 'licence()' for distribution details.

R is a collaborative project with many contributors.
Type 'contributors()' for more information and
'citation()' on how to cite R or R packages in publications.

Type 'demo()' for some demos, 'help()' for on-line help, or
'help.start()' for an HTML browser interface to help.
Type 'q()' to quit R.

> library(ICGOR)
Loading required package: survival
Loading required package: ICsurv
Loading required package: pracma
Loading required package: MASS
> png(filename="/home/ddbj/snapshot/RGM3/R_CC/result/ICGOR/GORH.Rd_%03d_medium.png", width=480, height=480)
> ### Name: GORH
> ### Title: The Main Function to Fit the GORH Model with Interval Censored
> ###   Data.
> ### Aliases: GORH
>
> ### ** Examples
>
> data(Hemophilia)
> # Set Left/Right Interval End Points as NA
> Hemophilia$L[Hemophilia$d1==1]<-Hemophilia$R[Hemophilia$d3==1]<-NA
> # Fit PO Model (r=1)
> fit<-GORH(Surv(L,R)~Low+Medium+High,data=Hemophilia,r=1)
NOTE: the QR decomposition is applied to solve the hessian matrix.
> summary(fit)
Call:
GORH(formula = Surv(L, R) ~ Low + Medium + High, data = Hemophilia,
    r = 1)

       Estimate  StdErr t.value   p.value
Low     2.26804 0.14716  15.412 < 2.2e-16 ***
Medium  4.10035 0.23241  17.643 < 2.2e-16 ***
High    5.02924 0.30065  16.728 < 2.2e-16 ***
---
Signif. codes:  0 '***' 0.001 '**' 0.01 '*' 0.05 '.' 0.1 ' ' 1
[1] "Loglik= -511.31"
>
> # Predict Survival Curve for a New Individual
> # Specify coveriate vectors for new.x
> pred1<-predict(fit,new.x=c(0,0,0))
> pred2<-predict(fit,new.x=c(1,0,0))
> pred3<-predict(fit,new.x=c(0,1,0))
> pred4<-predict(fit,new.x=c(0,0,1))
>
> # Plot the Survival Curves
> plot(pred1,xlab="Time",ylab="Survival Probability",ylim=c(0,1))
> lines(pred2$SurvTime,pred2$SurvProb,col=2)
> lines(pred3$SurvTime,pred3$SurvProb,col=3)
> lines(pred4$SurvTime,pred4$SurvProb,col=4)
> legend(0,0.2,c("None","Low","Medium","High"),lty=1,col=1:4)
>
>
>
>
>
> dev.off()
null device
          1
>
 .
.