Supported by Dr. Osamu Ogasawara and  . . |
|
Last data update: 2014.03.03 |
One step Tyler Shape MatrixDescriptionThis matrix can be used to get from UsagecovAxis(X, na.action = na.fail) Arguments
DetailsThe p ave{[(x_i-x_bar)S^{-1}(x_i-x_bar)']^(-1) (x_i-x_bar)'(x_i-x_bar)}, where x_bar is the mean vector and S the regular covariance matrix.
ValueMatrix of the estimated scatter. Author(s)Klaus Nordhausen ReferencesCritchley , F., Pires, A. and Amado, C. (2006), Principal axis analysis, Technical Report, 06/14, The Open University Milton Keynes. Tyler, D.E., Critchley, F., Dümbgen, L. and Oja, H. (2009), Invariant co-ordinate selecetion, Journal of the Royal Statistical Society,Series B, 71, 549–592. See Also
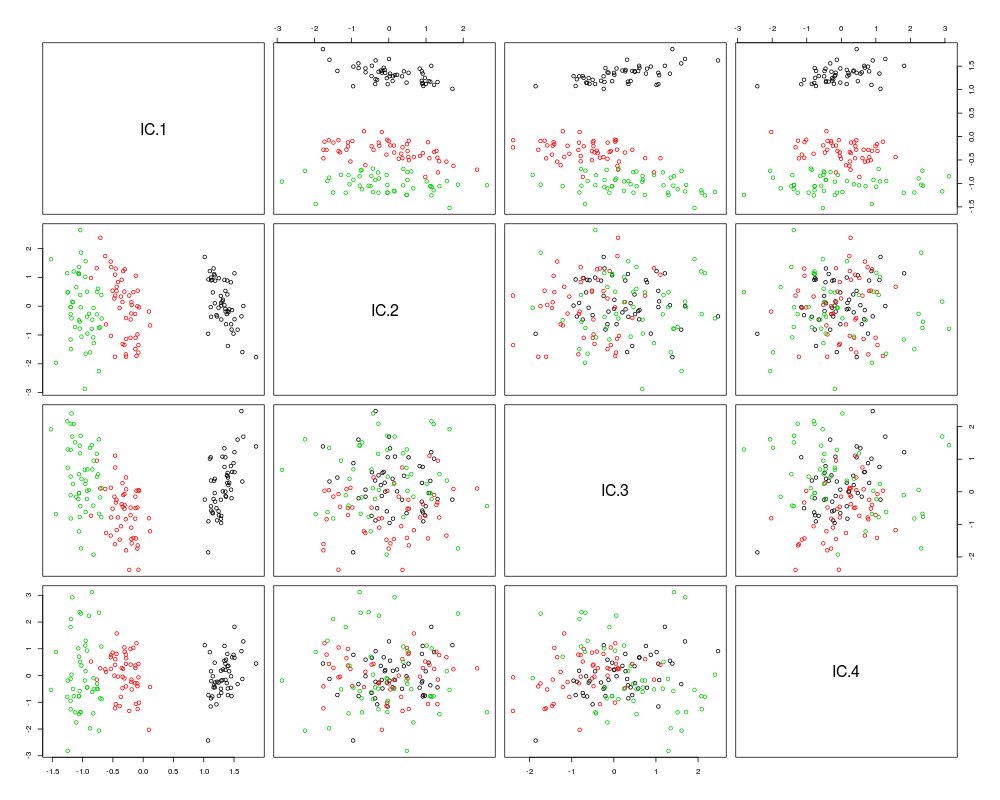
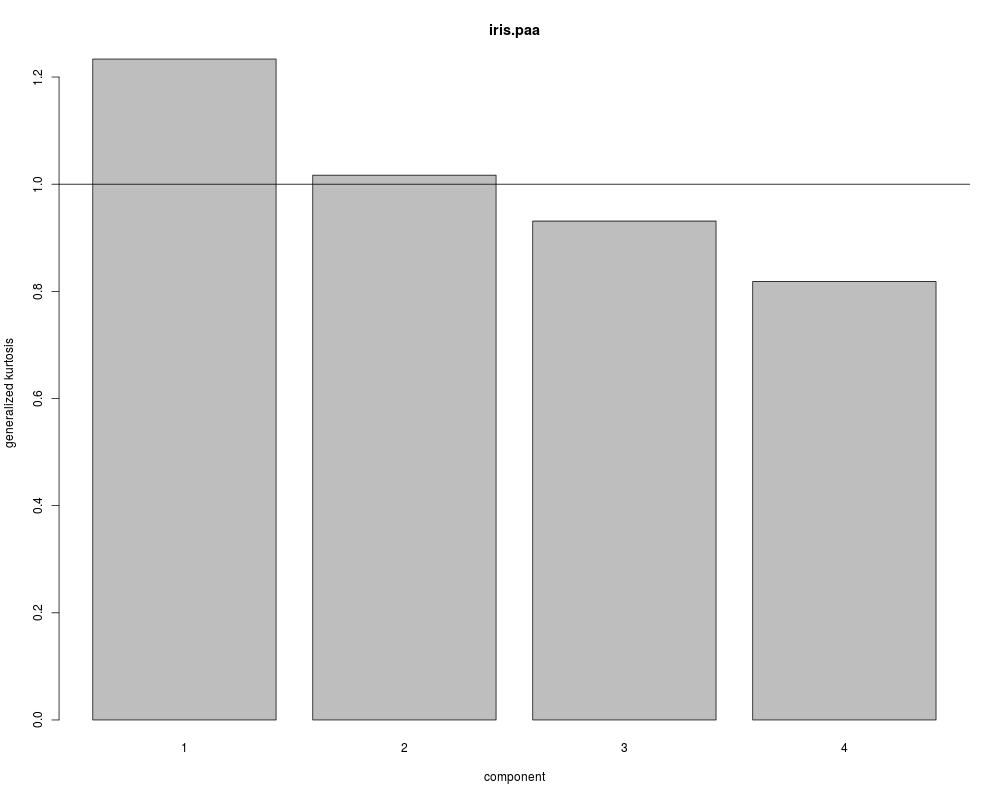
Examplesdata(iris) iris.centered <- sweep(iris[,1:4], 2, colMeans(iris[,1:4]), "-") iris.paa <- ics(iris.centered, cov, covAxis, stdKurt = FALSE) summary(iris.paa) plot(iris.paa, col=as.numeric(iris[,5])) mean(iris.paa@gKurt) emp.align <- iris.paa@gKurt emp.align screeplot(iris.paa) abline(h = 1) Results
R version 3.3.1 (2016-06-21) -- "Bug in Your Hair"
Copyright (C) 2016 The R Foundation for Statistical Computing
Platform: x86_64-pc-linux-gnu (64-bit)

R is free software and comes with ABSOLUTELY NO WARRANTY.
You are welcome to redistribute it under certain conditions.
Type 'license()' or 'licence()' for distribution details.

R is a collaborative project with many contributors.
Type 'contributors()' for more information and
'citation()' on how to cite R or R packages in publications.

Type 'demo()' for some demos, 'help()' for on-line help, or
'help.start()' for an HTML browser interface to help.
Type 'q()' to quit R.

> library(ICS)
Loading required package: mvtnorm
> png(filename="/home/ddbj/snapshot/RGM3/R_CC/result/ICS/covAxis.Rd_%03d_medium.png", width=480, height=480)
> ### Name: covAxis
> ### Title: One step Tyler Shape Matrix
> ### Aliases: covAxis
> ### Keywords: multivariate
>
> ### ** Examples
>
>
> data(iris)
> iris.centered <- sweep(iris[,1:4], 2, colMeans(iris[,1:4]), "-")
> iris.paa <- ics(iris.centered, cov, covAxis, stdKurt = FALSE)
> summary(iris.paa)

ICS based on two scatter matrices
S1:  cov
S2:  covAxis

The generalized kurtosis measures of the components are:
[1] 1.2336 1.0168 0.9312 0.8184


The Unmixing matrix is:
        [,1]   [,2]    [,3]    [,4]
[1,]  0.4038 0.1019 -0.5451 -0.3912
[2,] -3.1804 1.9819  2.1251 -1.6616
[3,] -0.0739 2.0609 -0.6686  2.2675
[4,] -0.1762 1.6949  2.1843 -4.4315
> plot(iris.paa, col=as.numeric(iris[,5]))
> mean(iris.paa@gKurt)
[1] 1
> emp.align <- iris.paa@gKurt
> emp.align
[1] 1.2336055 1.0168092 0.9311902 0.8183951
>
> screeplot(iris.paa)
> abline(h = 1)
>
>
>
>
>
>
>
>
> dev.off()
null device
          1
>
|