Supported by Dr. Osamu Ogasawara and  . . |
|
Last data update: 2014.03.03 |
Pretty Open or Closed ArrowsDescriptionDraws a set of open or closed arrows which can be shaped by
many arguments. Usage
Arrows(x1, y1, x2, y2, size = 1, width = 1.2/4/cin, open = TRUE,
       sh.adj = 0.1, sh.lwd = 1, sh.col = if (is.R()) par("fg") else 1,
       sh.lty = 1,
       h.col = sh.col, h.col.bo = sh.col, h.lwd = sh.lwd, h.lty = sh.lty,
       verbose = FALSE)
Arguments
DetailsDefinition of sh.adj:
ValueA value is only returned, when NoteThe plotting device should not be resized manually after plotting as this changes in general the aspect ratio of the plot and deforms hereby the plotted arrows. The beauty of the arrows depends from the resolution of the device. The higher resolutions give better results. Author(s)Andreas Ruckstuhl, refined by Rene Locher See Also
Examples
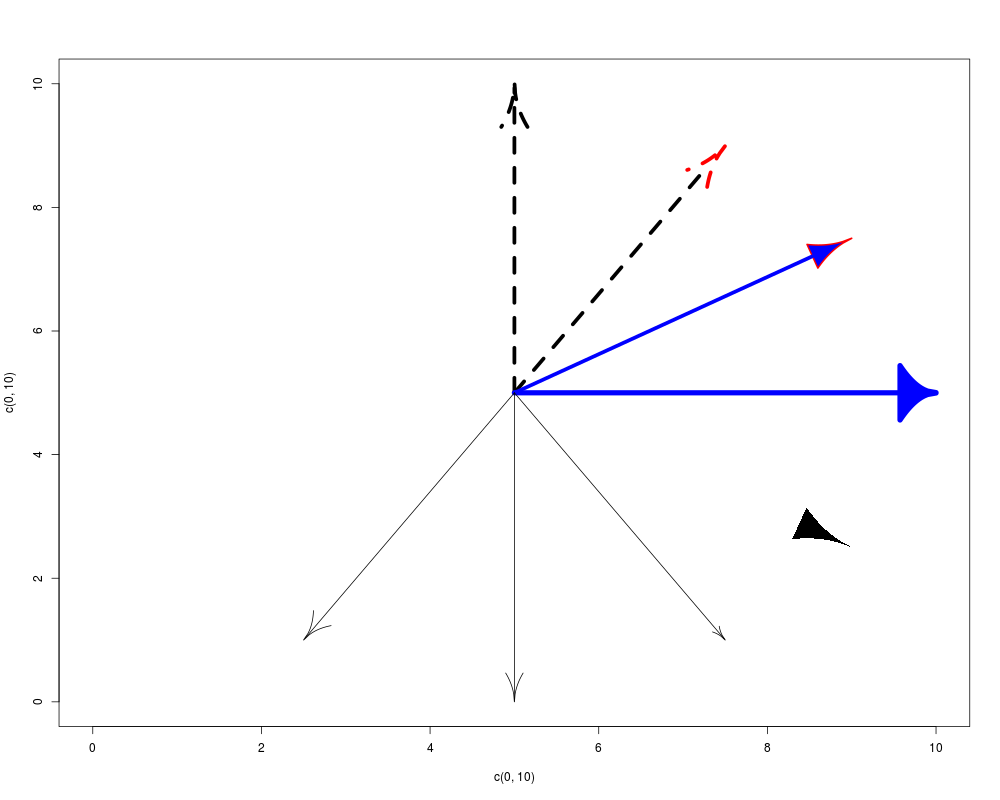
## a bunch of different arrows
plot(c(0,10), c(0,10), type="n")
Arrows(5, 5, 5,10, size=3,
sh.lwd=5, sh.lty=2,
h.lwd=5)
Arrows(5, 5, 7.5, 9, size=3, open=TRUE,
sh.adj=0.7, sh.lwd=5, sh.lty=2,
h.col.bo="red",h.lwd=5)
Arrows(5, 5, 9, 7.5, size=3, open=FALSE,
sh.adj=1, sh.lwd=5, sh.col="blue",
h.col.bo="red",h.lwd=2)
Arrows(5, 5, 10, 5, size=2.5, width=1.5, open=FALSE,
sh.adj=1, sh.lwd=7, sh.col="blue")
Arrows(5, 5, 9, 2.5, size=4, open=FALSE,
sh.lty=0,
h.col.bo="black",h.lwd=5)
Arrows(5, 5, 7.5, 1)
Arrows(5, 5, 5, 0, size=2)
Arrows(5, 5, 2.5, 1, size=2, width=1)
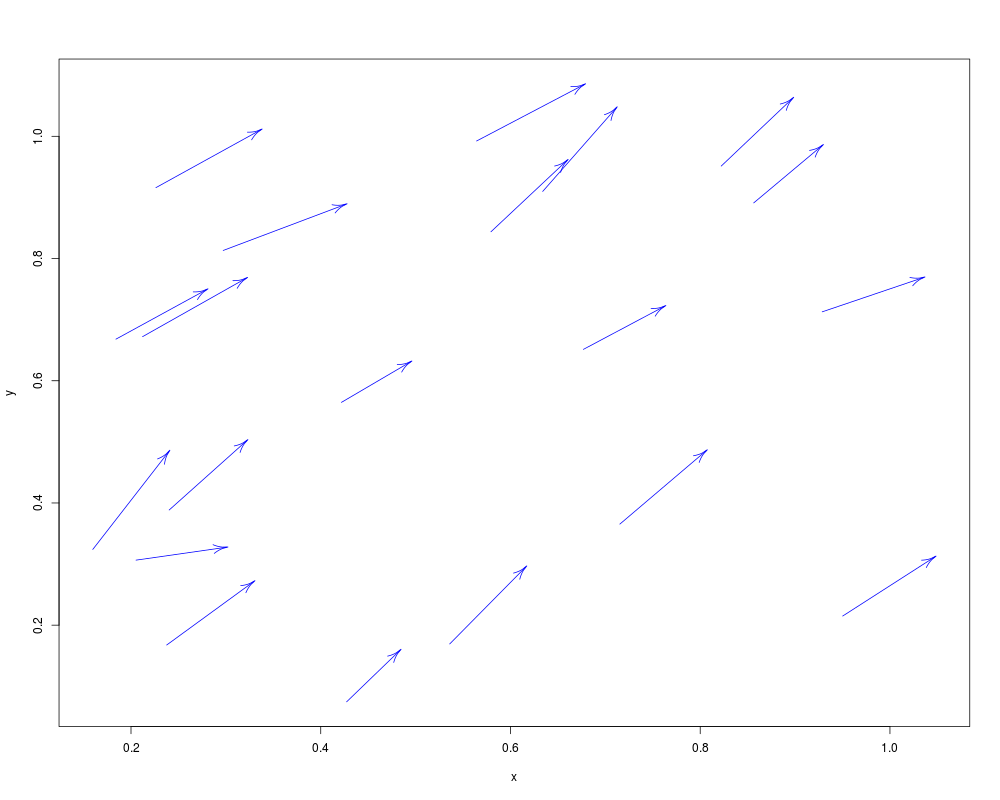
## vector field
x<- runif( 20)
y<- runif( 20)
u<- 0.1+0.02*rnorm(20)
v<- 0.1+0.02*rnorm(20)
plot(x,y,xlim=range(c(x,x+u)),ylim=range(c(y,y+v)),type="n")
Arrows(x,y,x+u,y+v,sh.col="blue")
Results
R version 3.3.1 (2016-06-21) -- "Bug in Your Hair"
Copyright (C) 2016 The R Foundation for Statistical Computing
Platform: x86_64-pc-linux-gnu (64-bit)

R is free software and comes with ABSOLUTELY NO WARRANTY.
You are welcome to redistribute it under certain conditions.
Type 'license()' or 'licence()' for distribution details.

R is a collaborative project with many contributors.
Type 'contributors()' for more information and
'citation()' on how to cite R or R packages in publications.

Type 'demo()' for some demos, 'help()' for on-line help, or
'help.start()' for an HTML browser interface to help.
Type 'q()' to quit R.

> library(IDPmisc)
Loading required package: grid
Loading required package: lattice
> png(filename="/home/ddbj/snapshot/RGM3/R_CC/result/IDPmisc/Arrows.Rd_%03d_medium.png", width=480, height=480)
> ### Name: Arrows
> ### Title: Pretty Open or Closed Arrows
> ### Aliases: Arrows
> ### Keywords: aplot
>
> ### ** Examples
>
> ## a bunch of different arrows
> plot(c(0,10), c(0,10), type="n")
> Arrows(5, 5, 5,10, size=3,
+        sh.lwd=5, sh.lty=2,
+        h.lwd=5)
> Arrows(5, 5, 7.5, 9, size=3, open=TRUE,
+        sh.adj=0.7, sh.lwd=5, sh.lty=2,
+        h.col.bo="red",h.lwd=5)
> Arrows(5, 5, 9, 7.5, size=3, open=FALSE,
+        sh.adj=1, sh.lwd=5, sh.col="blue",
+        h.col.bo="red",h.lwd=2)
> Arrows(5, 5, 10, 5, size=2.5, width=1.5, open=FALSE,
+        sh.adj=1, sh.lwd=7, sh.col="blue")
> Arrows(5, 5, 9, 2.5, size=4, open=FALSE,
+        sh.lty=0,
+        h.col.bo="black",h.lwd=5)
> Arrows(5, 5, 7.5, 1)
> Arrows(5, 5, 5, 0, size=2)
> Arrows(5, 5, 2.5, 1, size=2, width=1)
>
> ## vector field
> x<- runif( 20)
> y<- runif( 20)
> u<- 0.1+0.02*rnorm(20)
> v<- 0.1+0.02*rnorm(20)
> plot(x,y,xlim=range(c(x,x+u)),ylim=range(c(y,y+v)),type="n")
> Arrows(x,y,x+u,y+v,sh.col="blue")
>
>
>
>
>
> dev.off()
null device
          1
>
|