Supported by Dr. Osamu Ogasawara and  . . |
|
Last data update: 2014.03.03 |
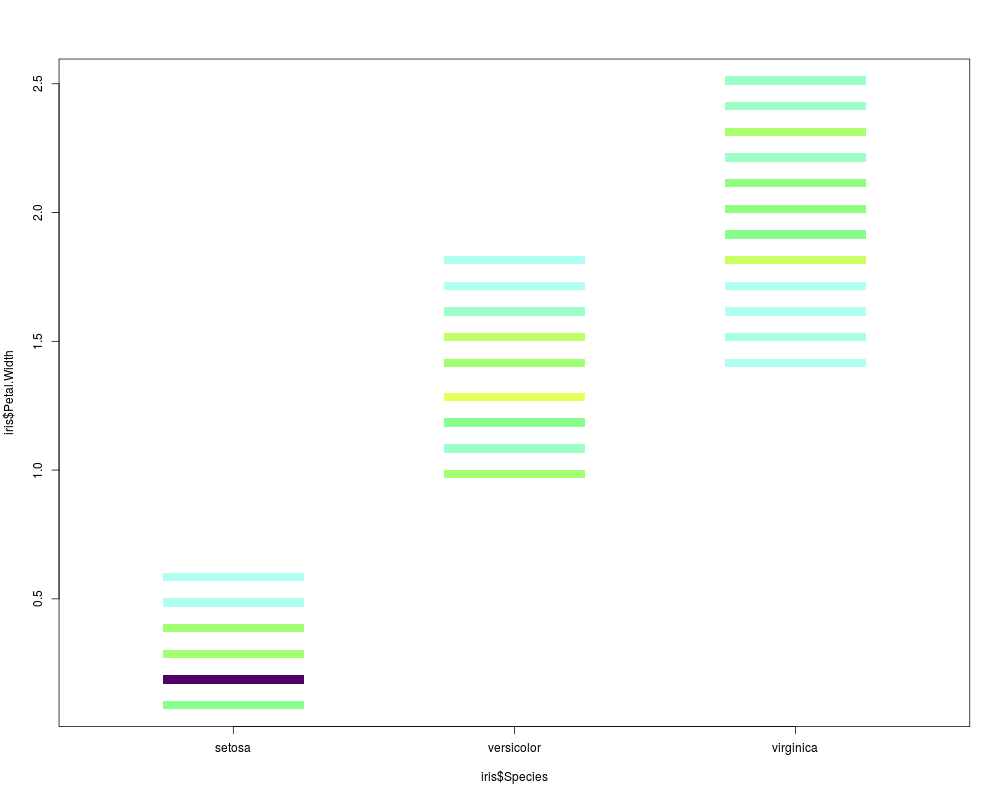
Display the Density of Points in a Scatter Plot by ColorsDescriptionThe density of points in a scatter plot is encoded by color. Usage
Image(x, y = NULL, pixs = 1, zmax = NULL, ztransf = function(x){x},
      colramp = IDPcolorRamp, factors = c(FALSE, FALSE),
      matrix = FALSE)
Arguments
DetailsBefore calling This function is based on graphics ValueMaximum number of counts per pixel found ( Author(s)Andreas Ruckstuhl, Rene Locher See Also
Examples
plot.default(iris$Species, iris$Petal.Width, xlim=c(0.5,3.5),
type="n", axes=FALSE)
axis(1, at=1:3, labels=levels(iris$Species))
axis(2)
Image(iris$Species, iris$Petal.Width, pixs=3)
##
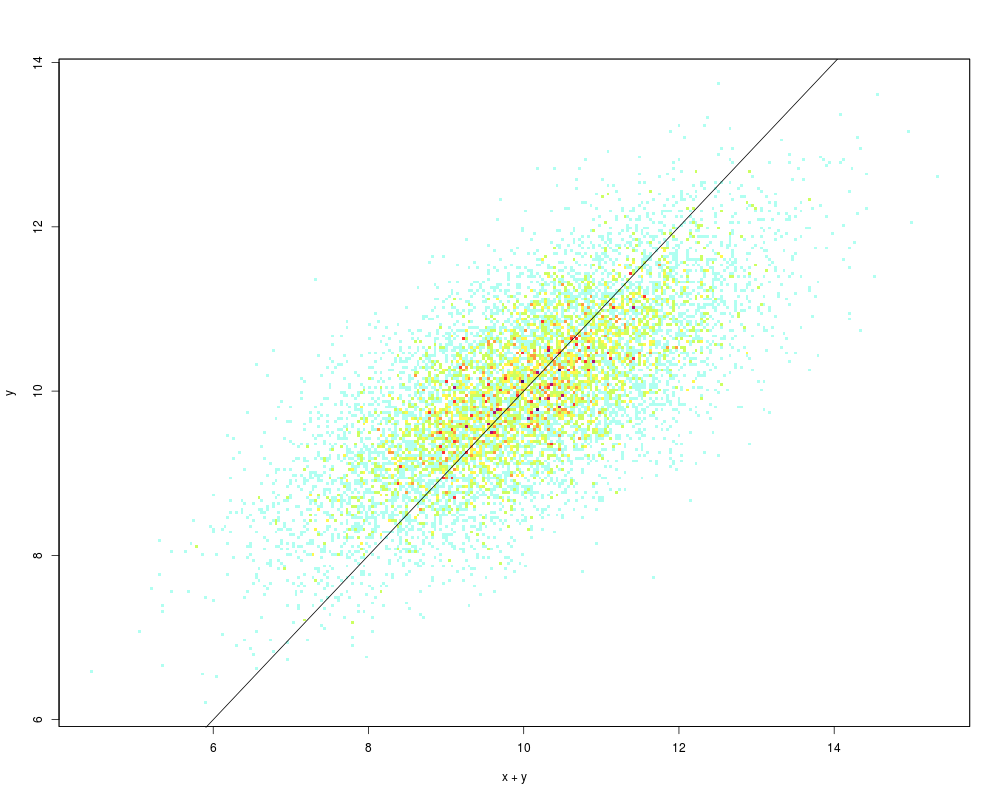
x <- rnorm(10000)
y <- rnorm(10000, 10)
plot(x+y, y, type="n")
Image(x+y, y)
abline(a=0, b=1)
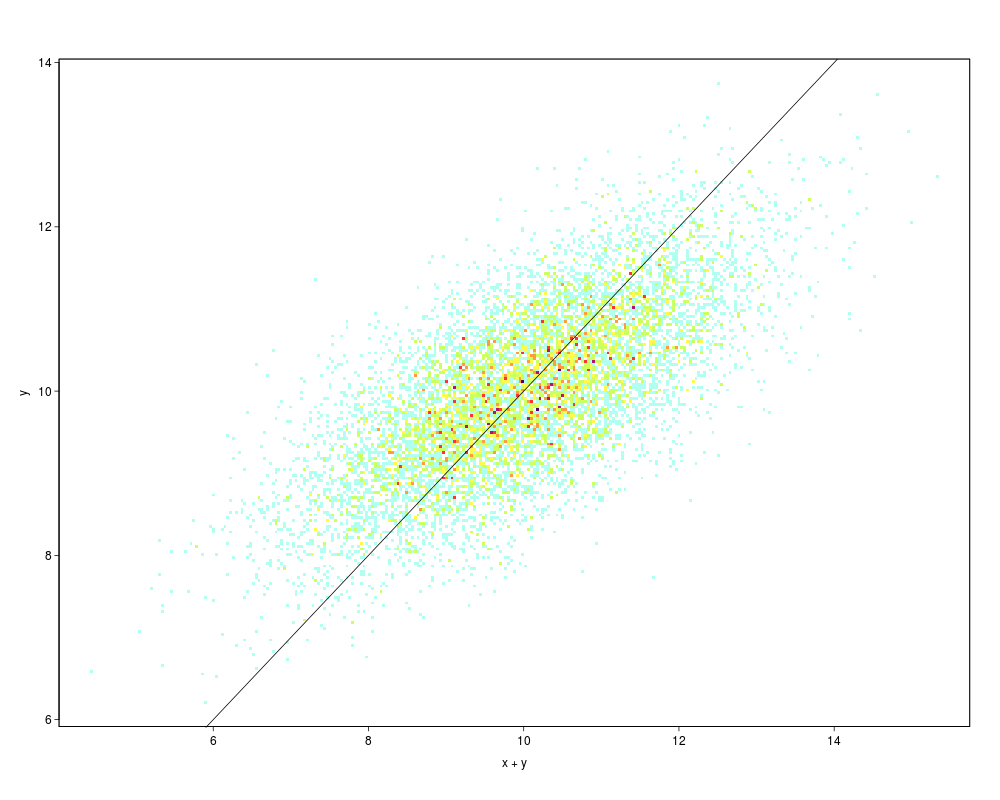
## The above can be merged to
iplot(x+y, y, legend=FALSE, oma=c(5, 4, 4, 2) + 0.1)
abline(a=0, b=1)
Results
R version 3.3.1 (2016-06-21) -- "Bug in Your Hair"
Copyright (C) 2016 The R Foundation for Statistical Computing
Platform: x86_64-pc-linux-gnu (64-bit)

R is free software and comes with ABSOLUTELY NO WARRANTY.
You are welcome to redistribute it under certain conditions.
Type 'license()' or 'licence()' for distribution details.

R is a collaborative project with many contributors.
Type 'contributors()' for more information and
'citation()' on how to cite R or R packages in publications.

Type 'demo()' for some demos, 'help()' for on-line help, or
'help.start()' for an HTML browser interface to help.
Type 'q()' to quit R.

> library(IDPmisc)
Loading required package: grid
Loading required package: lattice
> png(filename="/home/ddbj/snapshot/RGM3/R_CC/result/IDPmisc/Image.Rd_%03d_medium.png", width=480, height=480)
> ### Name: Image
> ### Title: Display the Density of Points in a Scatter Plot by Colors
> ### Aliases: Image
> ### Keywords: aplot
>
> ### ** Examples
>
> plot.default(iris$Species, iris$Petal.Width, xlim=c(0.5,3.5),
+              type="n", axes=FALSE)
> axis(1, at=1:3, labels=levels(iris$Species))
> axis(2)
> Image(iris$Species, iris$Petal.Width, pixs=3)
>
> ##
> x <- rnorm(10000)
> y <- rnorm(10000, 10)
> plot(x+y, y, type="n")
> Image(x+y, y)
> abline(a=0, b=1)
>
> ## The above can be merged to
> iplot(x+y, y, legend=FALSE, oma=c(5, 4, 4, 2) + 0.1)
> abline(a=0, b=1)
>
>
>
>
>
> dev.off()
null device
          1
>
|