Supported by Dr. Osamu Ogasawara and  . . |
|
Last data update: 2014.03.03 |
Plot Regression Terms for Huge DatasetsDescriptionPlots regression terms against their predictors, optionally with standard errors and partial residuals in a density plot. Usage
itermplot(model, data = NULL, envir = environment(formula(model)),
          partial.resid = FALSE, scale=0, pixs = 1,
          zmax=NULL, ztransf = function(x) {x}, colramp = IDPcolorRamp,
          terms = NULL, se = FALSE,
          xlabs = NULL, ylabs = NULL, main = NULL,
          col.term = "black", lwd.term = 2,
          col.se = "gray", lty.se = 2, lwd.se = 1,
          col.smth = "darkred", lty.smth = 2,
          lwd.smth = 2, span.smth = 2/3,
          ask = interactive() && nb.fig < n.tms &&
                .Device != "postscript",
          use.factor.levels = TRUE, smooth = NULL, ...)
Arguments
Details
For the partial.resid=TRUE option it must have a residuals method that
accepts type="partial", which The data argument should rarely be needed, but in some cases termplot may be unable to reconstruct the original data frame. Using na.action=na.exclude makes these problems less likely. Nothing sensible happens for interaction terms. ValueMaximum number of counts per pixel found. Author(s)Rene Locher See Also
Examples
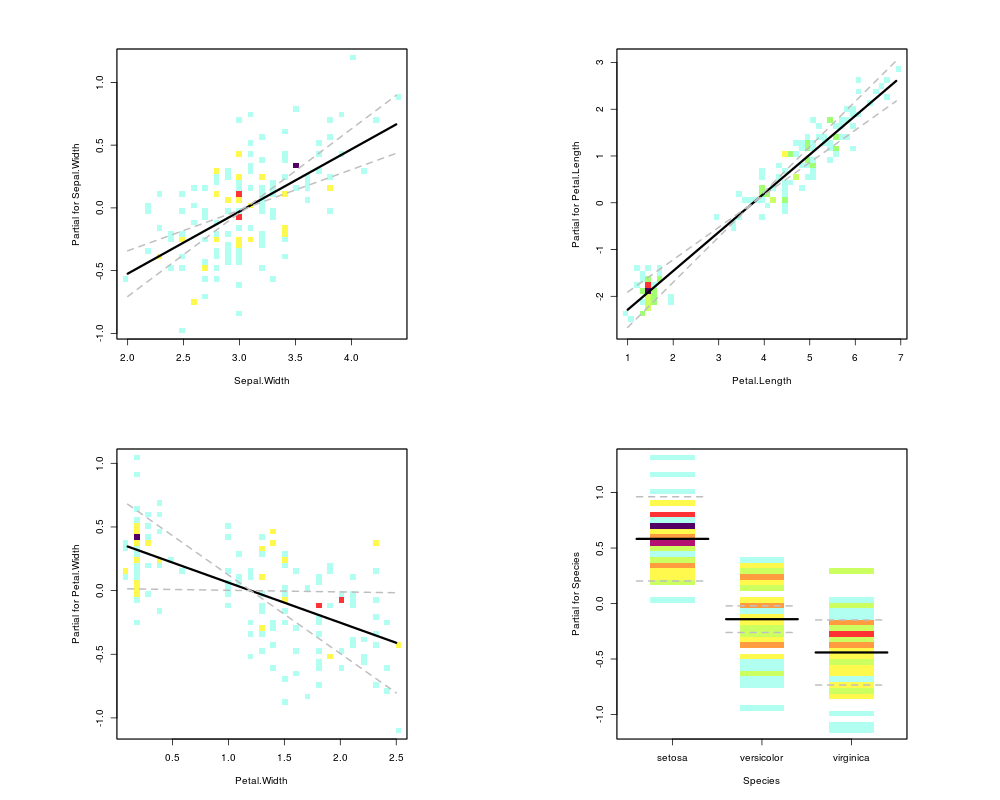
r.lm <- lm(Sepal.Length~Sepal.Width+Petal.Length+Petal.Width+Species,
data=iris)
par(mfrow=c(2,2),pty="s")
itermplot(r.lm, se = TRUE, partial.res=TRUE, lwd.term = 3,
lwd.se = 2, pixs = 2)
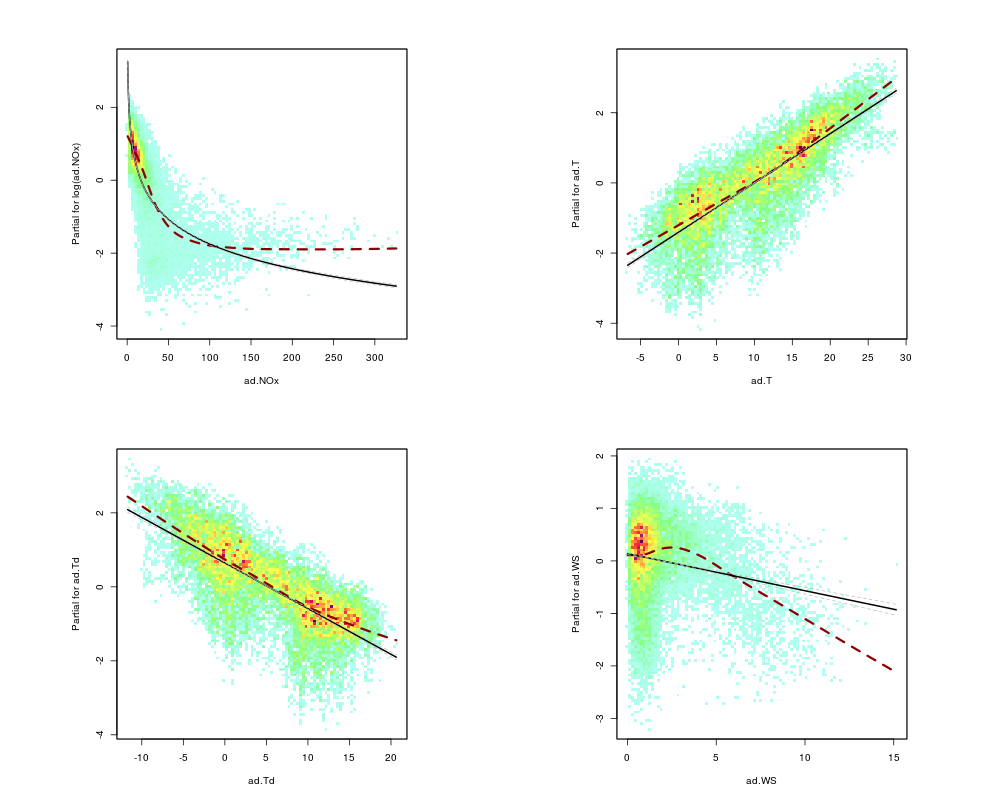
if (require(SwissAir)) {
data(AirQual)
r.lm <- lm(log(ad.O3)~log(ad.NOx)+ad.T+ad.Td+ad.WS, data=AirQual)
par(mfrow=c(2,2),pty="s")
itermplot(r.lm, se = TRUE, partial.resid=TRUE, smooth=ipanel.smooth,
lwd.smth = 3, pixs = 1, ask=FALSE)
} else print("Package SwissAir is not available")
Results
R version 3.3.1 (2016-06-21) -- "Bug in Your Hair"
Copyright (C) 2016 The R Foundation for Statistical Computing
Platform: x86_64-pc-linux-gnu (64-bit)

R is free software and comes with ABSOLUTELY NO WARRANTY.
You are welcome to redistribute it under certain conditions.
Type 'license()' or 'licence()' for distribution details.

R is a collaborative project with many contributors.
Type 'contributors()' for more information and
'citation()' on how to cite R or R packages in publications.

Type 'demo()' for some demos, 'help()' for on-line help, or
'help.start()' for an HTML browser interface to help.
Type 'q()' to quit R.

> library(IDPmisc)
Loading required package: grid
Loading required package: lattice
> png(filename="/home/ddbj/snapshot/RGM3/R_CC/result/IDPmisc/itermplot.Rd_%03d_medium.png", width=480, height=480)
> ### Name: itermplot
> ### Title: Plot Regression Terms for Huge Datasets
> ### Aliases: itermplot
> ### Keywords: hplot
>
> ### ** Examples
>
> r.lm <- lm(Sepal.Length~Sepal.Width+Petal.Length+Petal.Width+Species,
+            data=iris)
> par(mfrow=c(2,2),pty="s")
> itermplot(r.lm, se = TRUE, partial.res=TRUE, lwd.term = 3,
+           lwd.se = 2, pixs = 2)
>
> if (require(SwissAir)) {
+   data(AirQual)
+   r.lm <- lm(log(ad.O3)~log(ad.NOx)+ad.T+ad.Td+ad.WS, data=AirQual)
+   par(mfrow=c(2,2),pty="s")
+   itermplot(r.lm, se = TRUE, partial.resid=TRUE, smooth=ipanel.smooth,
+             lwd.smth = 3, pixs = 1, ask=FALSE)
+ } else print("Package SwissAir is not available")
Loading required package: SwissAir
>
>
>
>
>
>
> dev.off()
null device
          1
>
|