Supported by Dr. Osamu Ogasawara and  . . |
|
Last data update: 2014.03.03 |
Finding Peaks in Raw DataDescriptionReturns position, signal height and approximate width at half maximum peak height. Usagepeaks(x, y = NULL, minPH, minPW, thr, stepF = 0.49) Arguments
DetailsThe function is especially useful for signals in which both very broad and very narrow peaks are of interest. The peaks may lie very close to each other or might even be superpositioned on top of each other, e.g. peaks on broader shoulders. The algorithm is also very useful when the resolution of the signal is poor and the noise is small. The function is looking for peaks without any preceding baseline substraction or smoothing, which could distort the spectrum. The selection criteria Valuedataframe consisting of
NoteIn the function, the main selection criterium for the peaks is the height of the peaks, the second optional criterium is the width of the peaks. When the width of different peaks vary not too strongly and the
distances between the peaks is not critical, you might use the faster
function
Author(s)Rene Locher Examples
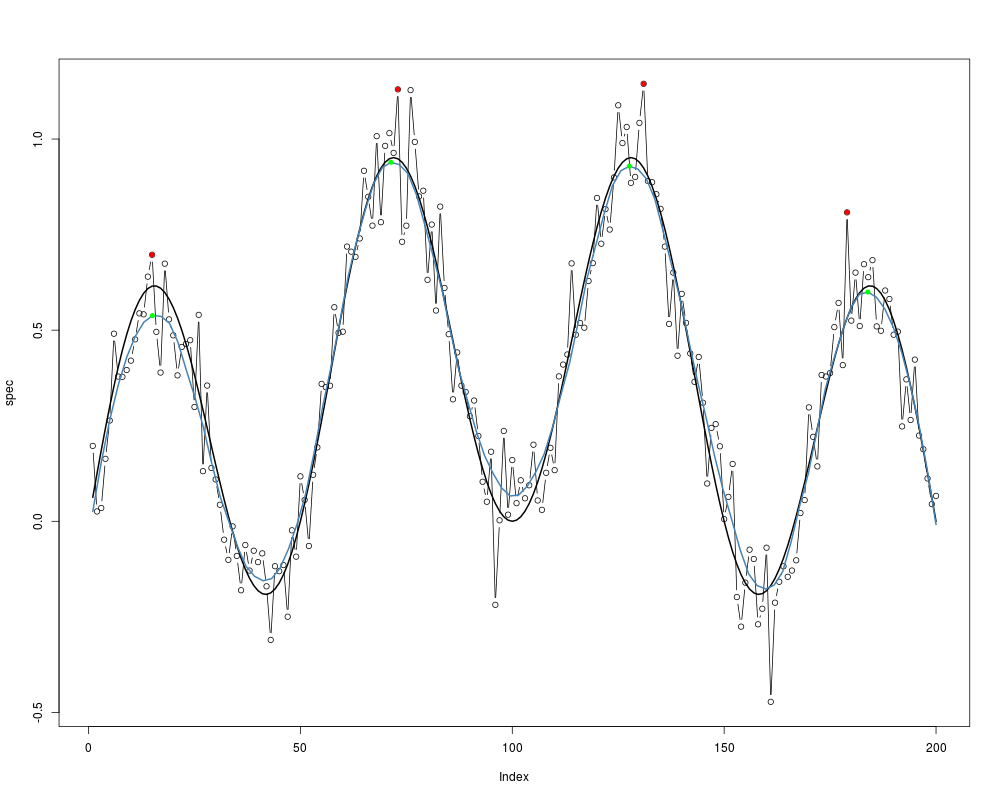
n <- 200
freq <- 1:n
theory <- sin(freq/n*4*pi)*cos(freq/n*3*pi)
spec <- theory + 0.1*rnorm(n)
plot(spec,type="b")
lines(theory,lwd=2)
pts <- peaks(spec, minPH=0.7)
points(pts,col="red",cex=1.2, pch=20)
## peaks after smoothing the spectrum
spec.sm <- loess.smooth(freq, spec, span=0.2,
degree = 2, evaluation = 100)
lines(spec.sm$x, spec.sm$y, col="steelblue", lwd=2)
pts <- peaks(spec.sm, minPH=0.4)
points(pts,col="green",cex=1.2,pch=20)
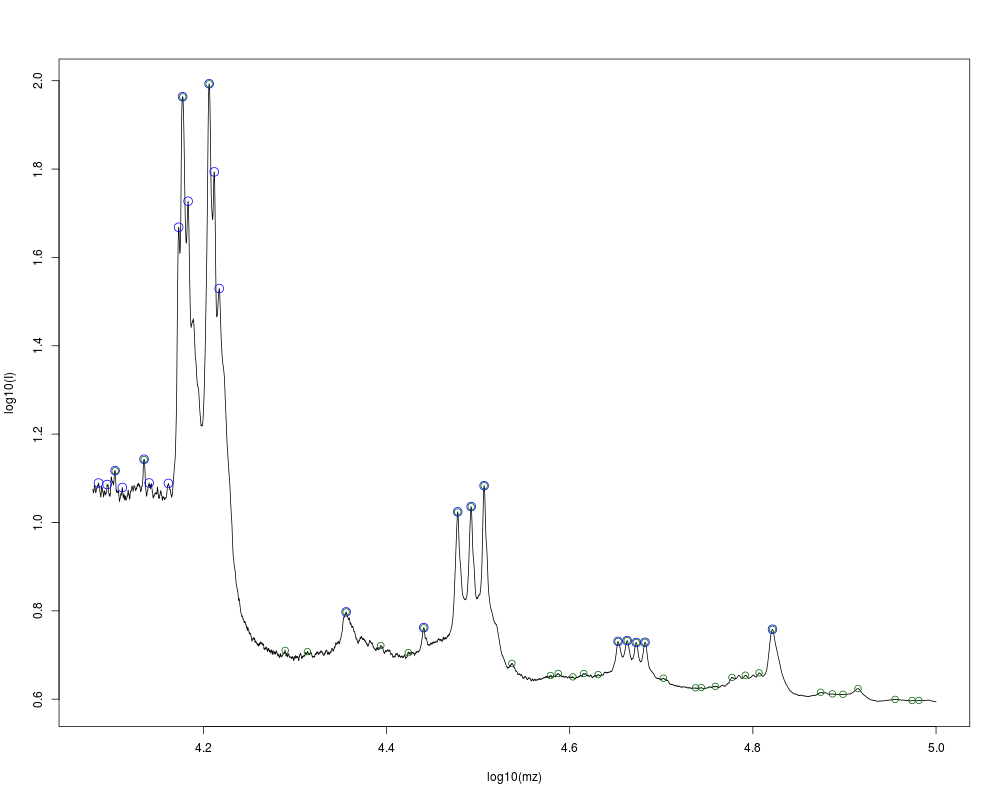
## Analyses of Mass Spectrum between 12000 and 100'000
## without smoothing, without baseline substraction
data(MS)
MS1 <- log10(MS[MS$mz>12000&MS$mz<1e5,])
P <- peaks(MS1, minPH=0.02, minPW=0.001)
plot(MS1, type="l", xlab="log10(mz)", ylab="log10(I)")
points(P,col="blue",cex=1.6)
## compare to
if (require(PROcess)) {
ii <- peaks(MS1$I,span=300)
detach("package:PROcess")
points(MS1$mz[ii],MS1$I[ii],col="darkgreen",cex=1.2)
} else print("Package Process not available!")
Results
R version 3.3.1 (2016-06-21) -- "Bug in Your Hair"
Copyright (C) 2016 The R Foundation for Statistical Computing
Platform: x86_64-pc-linux-gnu (64-bit)

R is free software and comes with ABSOLUTELY NO WARRANTY.
You are welcome to redistribute it under certain conditions.
Type 'license()' or 'licence()' for distribution details.

R is a collaborative project with many contributors.
Type 'contributors()' for more information and
'citation()' on how to cite R or R packages in publications.

Type 'demo()' for some demos, 'help()' for on-line help, or
'help.start()' for an HTML browser interface to help.
Type 'q()' to quit R.

> library(IDPmisc)
Loading required package: grid
Loading required package: lattice
> png(filename="/home/ddbj/snapshot/RGM3/R_CC/result/IDPmisc/peaks.Rd_%03d_medium.png", width=480, height=480)
> ### Name: peaks
> ### Title: Finding Peaks in Raw Data
> ### Aliases: peaks
> ### Keywords: manip dplot
>
> ### ** Examples
>
> n <- 200
> freq <- 1:n
> theory <- sin(freq/n*4*pi)*cos(freq/n*3*pi)
> spec <- theory + 0.1*rnorm(n)
>
> plot(spec,type="b")
> lines(theory,lwd=2)
>
> pts <- peaks(spec, minPH=0.7)
> points(pts,col="red",cex=1.2, pch=20)
>
> ## peaks after smoothing the spectrum
> spec.sm <- loess.smooth(freq, spec, span=0.2,
+                         degree = 2, evaluation = 100)
> lines(spec.sm$x, spec.sm$y, col="steelblue", lwd=2)
> pts <- peaks(spec.sm, minPH=0.4)
> points(pts,col="green",cex=1.2,pch=20)
>
> ## Analyses of Mass Spectrum between 12000 and 100'000
> ## without smoothing, without baseline substraction
> data(MS)
> MS1 <- log10(MS[MS$mz>12000&MS$mz<1e5,])
>
> P <- peaks(MS1, minPH=0.02, minPW=0.001)
> plot(MS1, type="l", xlab="log10(mz)", ylab="log10(I)")
> points(P,col="blue",cex=1.6)
>
> ## compare to
> if (require(PROcess)) {
+   ii <- peaks(MS1$I,span=300)
+   detach("package:PROcess")
+   points(MS1$mz[ii],MS1$I[ii],col="darkgreen",cex=1.2)
+ } else print("Package Process not available!")
Loading required package: PROcess
Loading required package: Icens
Loading required package: survival

Attaching package: 'PROcess'

The following object is masked from 'package:IDPmisc':

    peaks

The following object is masked from 'package:stats':

    sigma

>
>
>
>
>
>
> dev.off()
null device
          1
>
|