A vector, data.frame or matrix. When x is data.frame or
matrix only first two columns are used.
y
A vector or NULL
type
See Argument type in par
col
Color of points. If length(col) > 1, colors are recycled.
col.axis
Color of axis.
col.lab
Color of labels on axis.
col.fg
Color of foreground.
col.bg
Color of background outside of figure.
col.box
Color of background inside of figure
xlim
Limits of x-axis.
ylim
Limits of y-axis
xlab
Label of x-axis
ylab
Label of y-axis
main
Titel.
cex
Size of characters.
axes
Should axis be plotted?
...
Additional arguments to par.
Details
Side effect: par options will remain changed so that other
graphic elements can be added comfortably.
Author(s)
Andreas Ruckstuhl, refined by Rene Locher
Examples
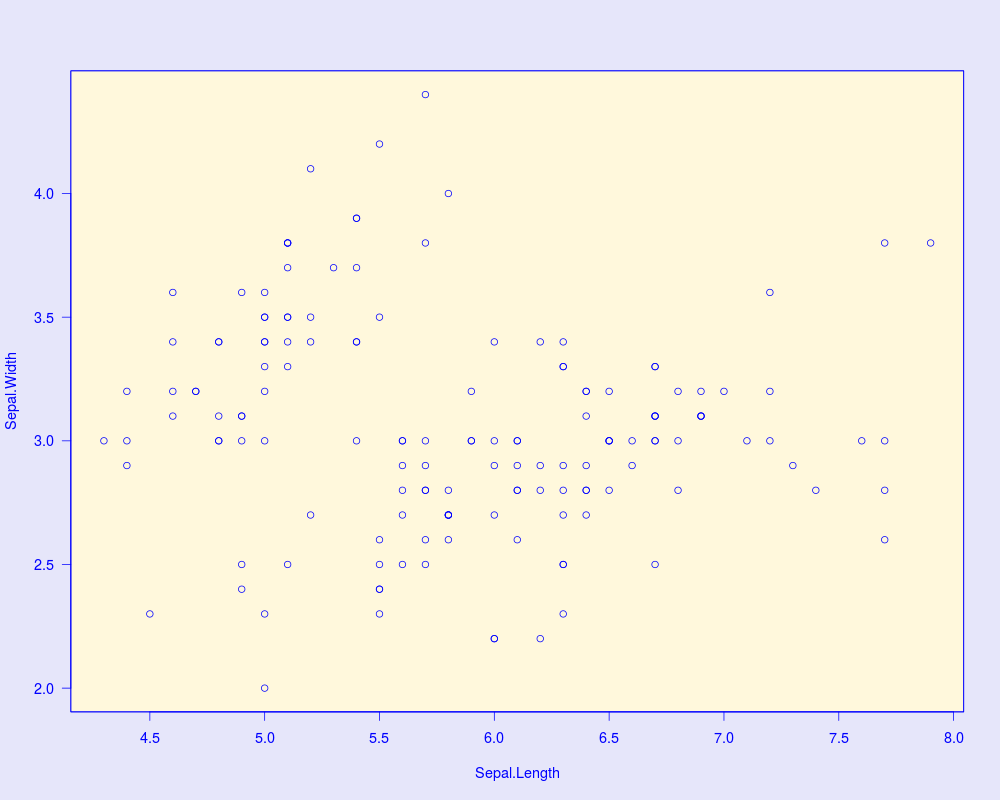
poster.plot(iris[,1],iris[,2],
xlab="Sepal.Length", ylab="Sepal.Width")
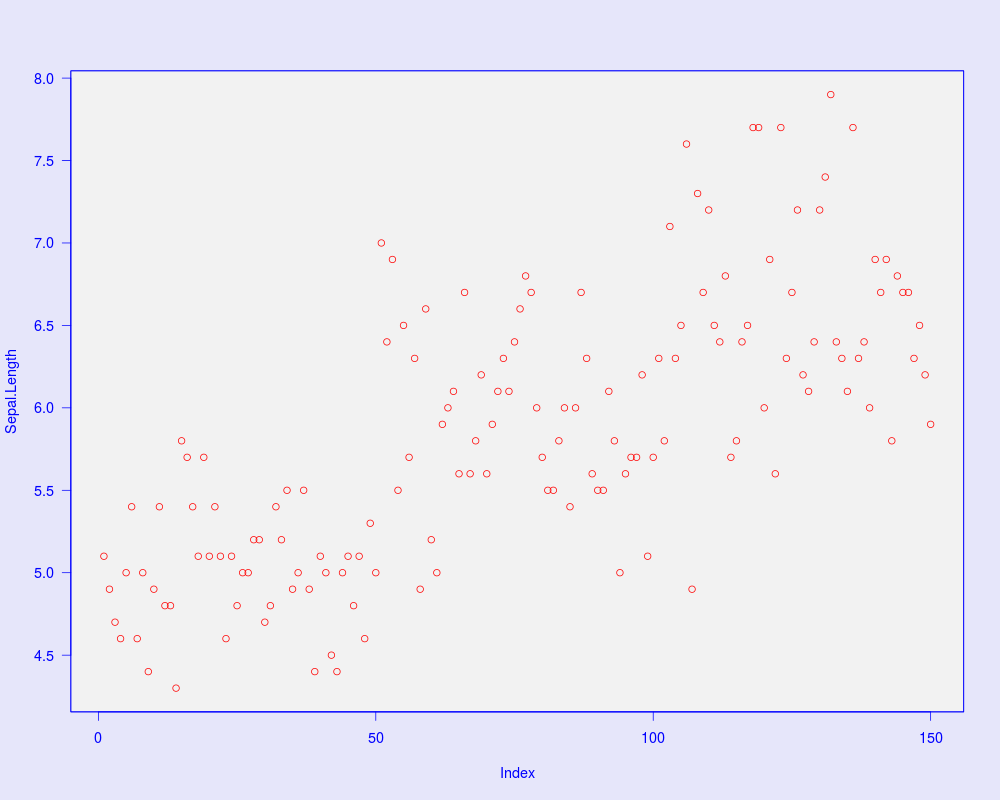
poster.plot(iris[,1], col="red", col.box="grey95", ylab="Sepal.Length")
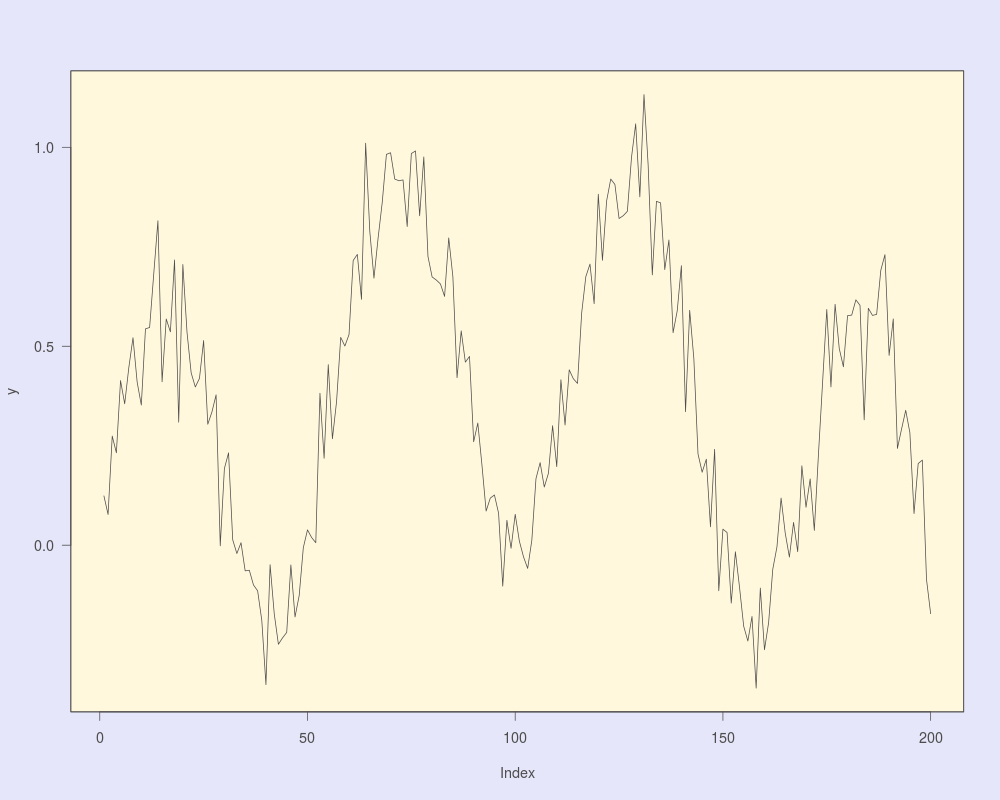
## plotting lines
n <- 200
freq <- 1:n
y <- sin(freq/n*4*pi)*cos(freq/n*3*pi) + 0.1*rnorm(n)
poster.plot(y,col.fg="grey30",type="l")
Results
R version 3.3.1 (2016-06-21) -- "Bug in Your Hair"
Copyright (C) 2016 The R Foundation for Statistical Computing
Platform: x86_64-pc-linux-gnu (64-bit)

R is free software and comes with ABSOLUTELY NO WARRANTY.
You are welcome to redistribute it under certain conditions.
Type 'license()' or 'licence()' for distribution details.

R is a collaborative project with many contributors.
Type 'contributors()' for more information and
'citation()' on how to cite R or R packages in publications.

Type 'demo()' for some demos, 'help()' for on-line help, or
'help.start()' for an HTML browser interface to help.
Type 'q()' to quit R.

> library(IDPmisc)
Loading required package: grid
Loading required package: lattice
> png(filename="/home/ddbj/snapshot/RGM3/R_CC/result/IDPmisc/poster.plot.Rd_%03d_medium.png", width=480, height=480)
> ### Name: poster.plot
> ### Title: Convenient xyplot with Differently Colored Margin and Plot
> ###   Region
> ### Aliases: poster.plot
> ### Keywords: hplot
>
> ### ** Examples
>
> poster.plot(iris[,1],iris[,2],
+             xlab="Sepal.Length", ylab="Sepal.Width")
>
> poster.plot(iris[,1], col="red", col.box="grey95", ylab="Sepal.Length")
>
> ## plotting lines
> n <- 200
> freq <- 1:n
> y <- sin(freq/n*4*pi)*cos(freq/n*3*pi) + 0.1*rnorm(n)
> poster.plot(y,col.fg="grey30",type="l")
>
>
>
>
>
> dev.off()
null device
          1
>
 .
.