Supported by Dr. Osamu Ogasawara and  . . |
|
Last data update: 2014.03.03 |
Displays vectors of colorsDescriptionDisplays colors produced by a color vector Usage
showColors(col = IDPcolorRamp(20),
           ntm = min(length(col), 20),
           border = TRUE, mar = rep(0,4))
Arguments
Author(s)Rene Locher See Also
Examples
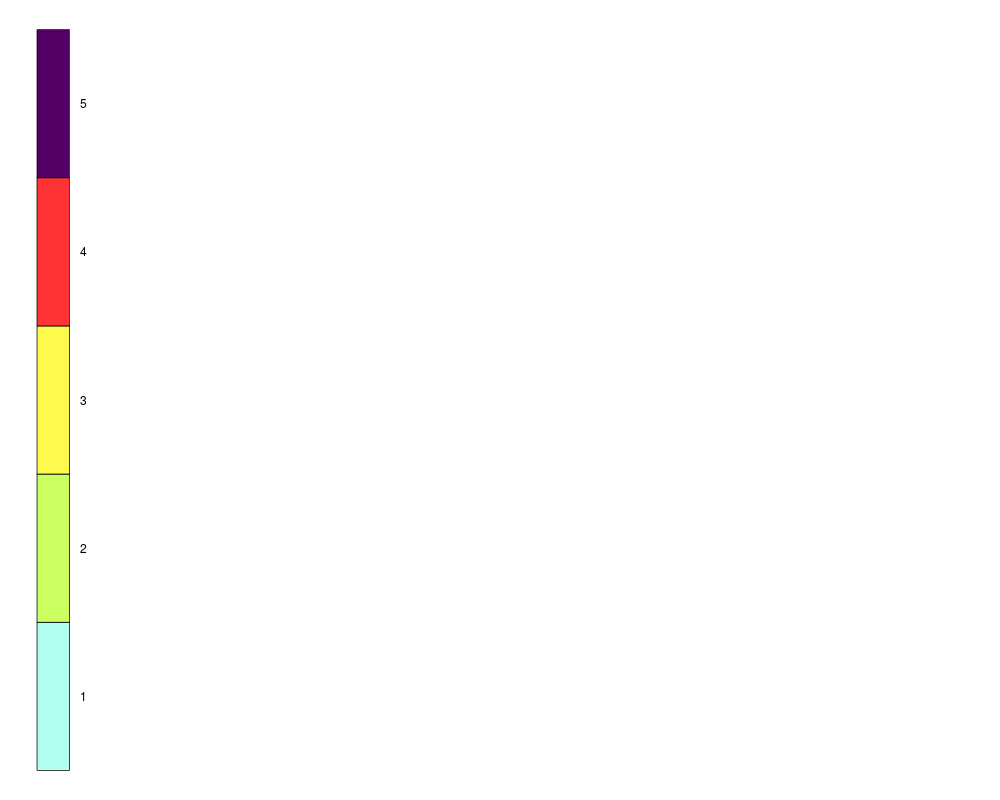
showColors(IDPcolorRamp(5))
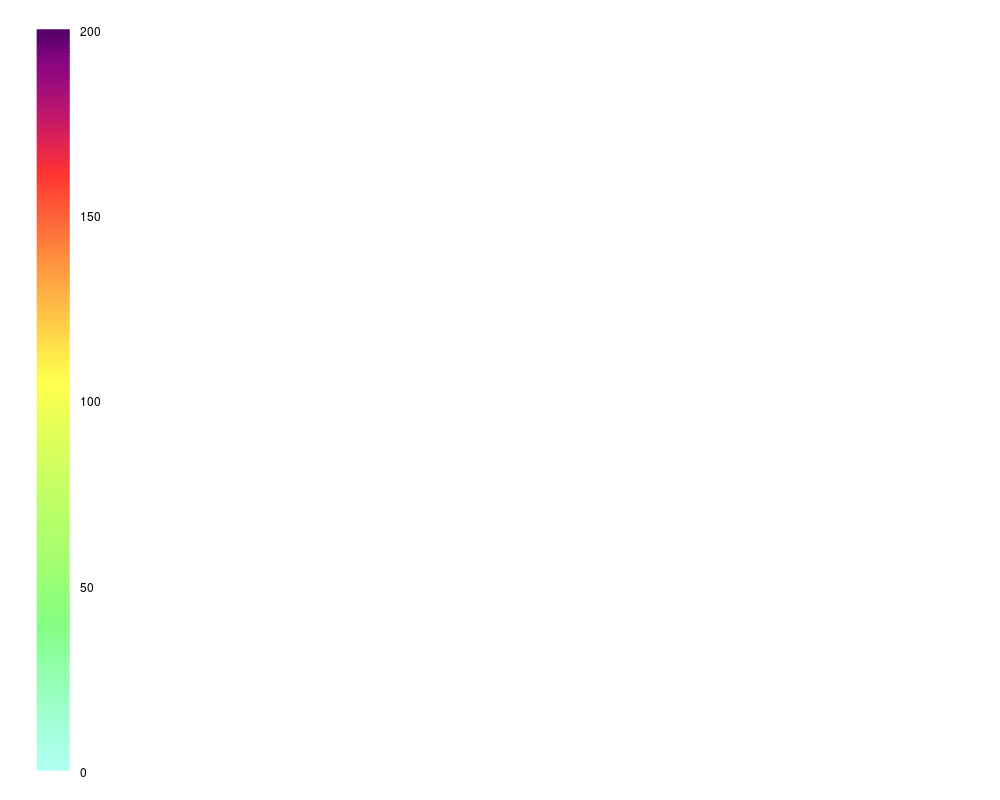
showColors(IDPcolorRamp(200),border=FALSE)
showColors(IDPcolorRamp(200),border=FALSE,ntm=5)
showColors(IDPcolorRamp(4,
colInt = data.frame(
h = c(0.47, 0.28, 0.22, 0.2, 0.00),
s = c(0.3, 0.55, 0.75, 0.75, 0.75),
v = c(1, 1, 1, 1, 1)),
fr = c(0.2,0.2,0.2))
,border=FALSE)
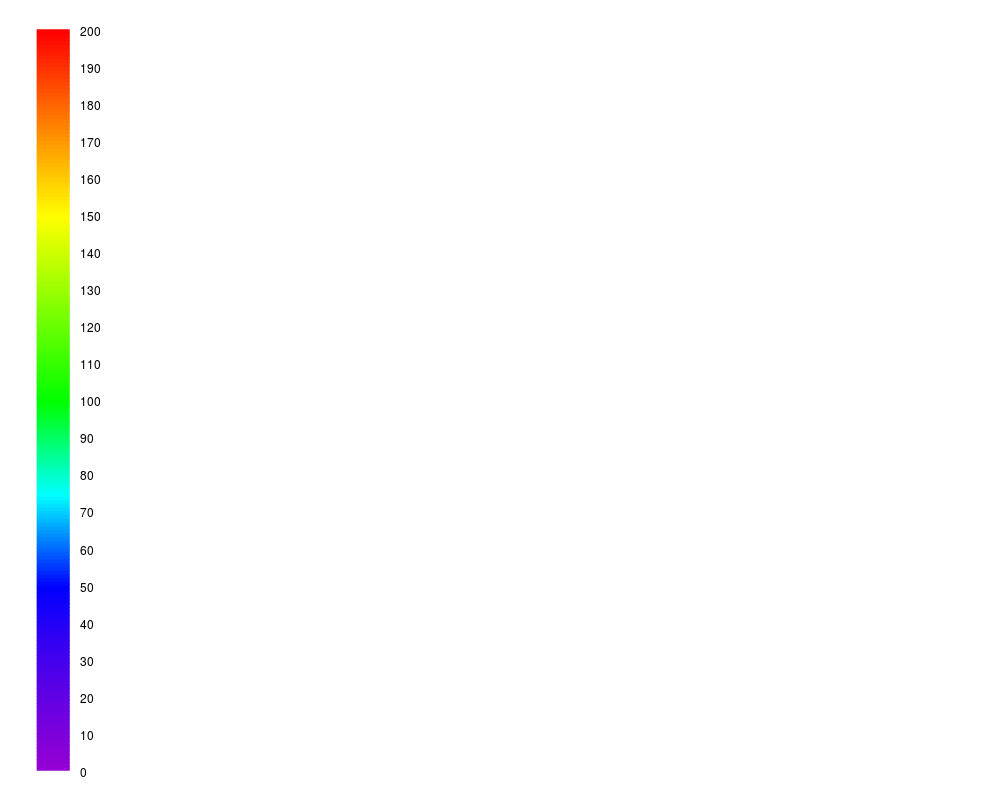
showColors(IDPcolorRamp(200,
t(col2hsv(c("darkviolet","blue",
"green","yellow","red"))),
fr=rep(0.25,3)),border=FALSE)
Results
R version 3.3.1 (2016-06-21) -- "Bug in Your Hair"
Copyright (C) 2016 The R Foundation for Statistical Computing
Platform: x86_64-pc-linux-gnu (64-bit)

R is free software and comes with ABSOLUTELY NO WARRANTY.
You are welcome to redistribute it under certain conditions.
Type 'license()' or 'licence()' for distribution details.

R is a collaborative project with many contributors.
Type 'contributors()' for more information and
'citation()' on how to cite R or R packages in publications.

Type 'demo()' for some demos, 'help()' for on-line help, or
'help.start()' for an HTML browser interface to help.
Type 'q()' to quit R.

> library(IDPmisc)
Loading required package: grid
Loading required package: lattice
> png(filename="/home/ddbj/snapshot/RGM3/R_CC/result/IDPmisc/showColors.Rd_%03d_medium.png", width=480, height=480)
> ### Name: showColors
> ### Title: Displays vectors of colors
> ### Aliases: showColors
> ### Keywords: color hplot
>
> ### ** Examples
>
> showColors(IDPcolorRamp(5))
> showColors(IDPcolorRamp(200),border=FALSE)
> showColors(IDPcolorRamp(200),border=FALSE,ntm=5)
>
> showColors(IDPcolorRamp(4,
+                         colInt = data.frame(
+                             h = c(0.47, 0.28, 0.22, 0.2, 0.00),
+                             s = c(0.3, 0.55, 0.75, 0.75, 0.75),
+                             v = c(1, 1, 1, 1, 1)),
+                         fr     = c(0.2,0.2,0.2))
+            ,border=FALSE)
>
> showColors(IDPcolorRamp(200,
+                         t(col2hsv(c("darkviolet","blue",
+                                     "green","yellow","red"))),
+                         fr=rep(0.25,3)),border=FALSE)
>
>
>
>
>
>
> dev.off()
null device
          1
>
|


Created & Maintained by Osamu Ogasawara (osamu.ogasawara@gmail.com) and 