Supported by Dr. Osamu Ogasawara and  . . |
|
Last data update: 2014.03.03 |
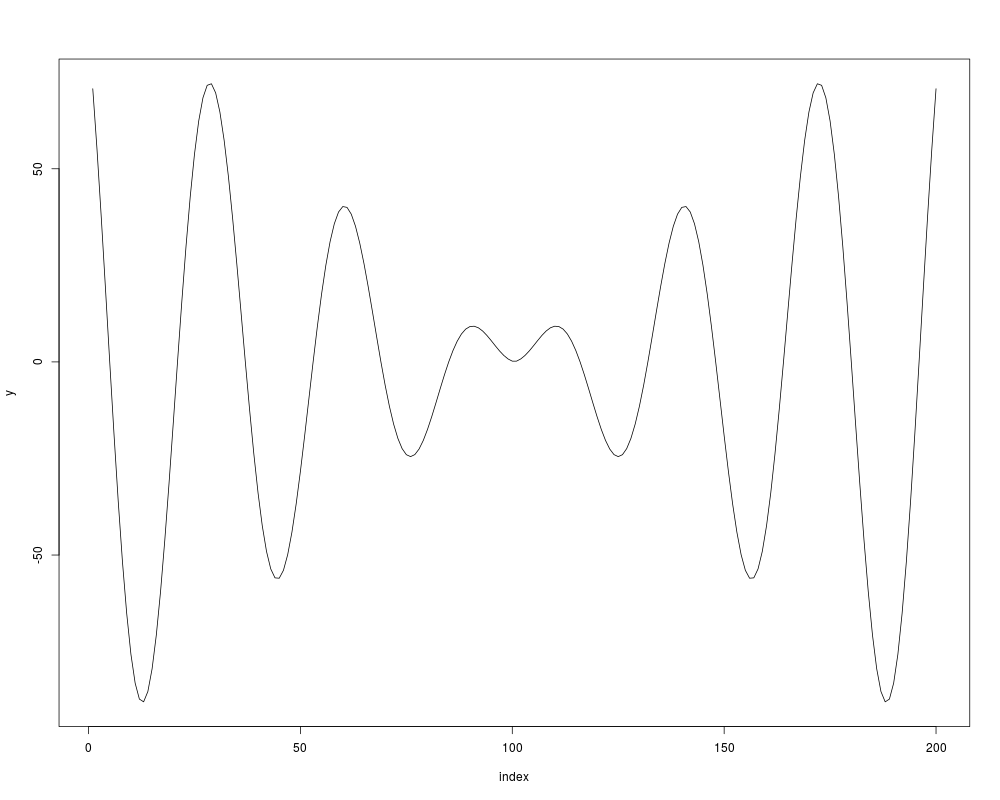
Zooming in and out in a 2d-PlotDescriptionFunction to zoom in and out by mouse click in a 2D-plot. Usagezoom(fun = plot, zoom.col = "red", delay = 3, ...) Arguments
DetailsWhen the clicked points lay within the plot region range, the points define the new plotting limits. When the clicked points lay in the margin, the plotting limits will be moved into the corresponding direction by 1/3 out of the actual range. There is no special sequential order for the zooming points required. The zooming function is stopped by right clicking and choosing the menu item "stop". ValueNo value returned. Author(s)Rene Locher Examplesi <- 1:100 y <- i*sin(i*(pi/16)) y <- c(rev(y),y) ## Not run: zoom(fun=plot, zoom.col="red", x=1:200, y=y, type="l", xlab="index") ## End( Not run) Results
R version 3.3.1 (2016-06-21) -- "Bug in Your Hair"
Copyright (C) 2016 The R Foundation for Statistical Computing
Platform: x86_64-pc-linux-gnu (64-bit)

R is free software and comes with ABSOLUTELY NO WARRANTY.
You are welcome to redistribute it under certain conditions.
Type 'license()' or 'licence()' for distribution details.

R is a collaborative project with many contributors.
Type 'contributors()' for more information and
'citation()' on how to cite R or R packages in publications.

Type 'demo()' for some demos, 'help()' for on-line help, or
'help.start()' for an HTML browser interface to help.
Type 'q()' to quit R.

> library(IDPmisc)
Loading required package: grid
Loading required package: lattice
> png(filename="/home/ddbj/snapshot/RGM3/R_CC/result/IDPmisc/zoom.Rd_%03d_medium.png", width=480, height=480)
> ### Name: zoom
> ### Title: Zooming in and out in a 2d-Plot
> ### Aliases: zoom
> ### Keywords: iplot dynamic
>
> ### ** Examples
>
> i <- 1:100
> y <- i*sin(i*(pi/16))
> y <- c(rev(y),y)
>
> ## Not run:
> zoom(fun=plot, zoom.col="red", x=1:200, y=y, type="l", xlab="index")
Click mouse at corners of zoom area.
Right click to stop zooming


> ## End( Not run)
>
>
>
>
>
> dev.off()
null device
          1
>
|
Created & Maintained by Osamu Ogasawara (osamu.ogasawara@gmail.com) and 