R: This function is used to compute the FDA Mandel's h...
h.fqcs
R Documentation
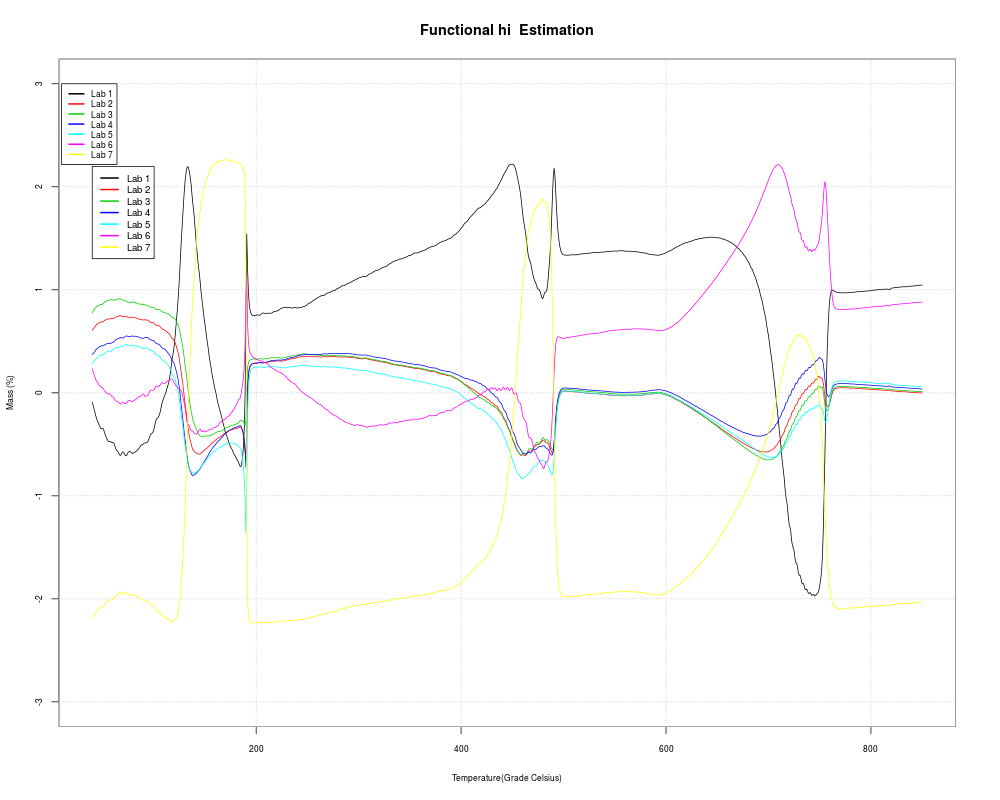
This function is used to compute the FDA Mandel's h statistic.
Description
It develops an object of 'h.fqcs' class to perform statistical quality control analysis.
This function is used to compute the functional approach of Mandel's h statistic.
It is specifically designed to deal with experimental data results defined by curves such as thermograms and spectra.
A (m x p) matrix or data-frame. Alternatively an (m x p x n) array.
The m parameter is the number of curves, p defines the number of points observed in each curve,
and n is the number of replicates.
...
Arguments passed to or from methods.
argvals
Argvals, by default: 1:p.
rangeval
Range of discretization points, by default: range(argvals).
References
Febrero-Bande, M. and Oviedo, M. (2012),
"Statistical computing in functional data analysis: the R package fda.usc". Journal of Statistical Software 51 (4), 1-28.
Cuevas A., Febrero-Bande, M. and Fraiman, R. (2006), "On the use of the bootstrap for estimating functions with functional data".
Computational Statistics & Data Analysis 51, 2, 1063-1074.
Naya, S., Tarrio-Saavedra. J., Lopez- Beceiro, J., Francisco Fernandez, M., Flores, M. and Artiaga, R. (2014),
"Statistical functional approach for interlaboratory studies with thermal data". Journal of Thermal Analysis and Calorimetry, 118,1229-1243.
R version 3.3.1 (2016-06-21) -- "Bug in Your Hair"
Copyright (C) 2016 The R Foundation for Statistical Computing
Platform: x86_64-pc-linux-gnu (64-bit)

R is free software and comes with ABSOLUTELY NO WARRANTY.
You are welcome to redistribute it under certain conditions.
Type 'license()' or 'licence()' for distribution details.

R is a collaborative project with many contributors.
Type 'contributors()' for more information and
'citation()' on how to cite R or R packages in publications.

Type 'demo()' for some demos, 'help()' for on-line help, or
'help.start()' for an HTML browser interface to help.
Type 'q()' to quit R.

> library(ILS)
Loading required package: multcomp
Loading required package: mvtnorm
Loading required package: survival
Loading required package: TH.data
Loading required package: MASS

Attaching package: 'TH.data'

The following object is masked from 'package:MASS':

    geyser

Loading required package: depthTools
Loading required package: fda.usc
Loading required package: fda
Loading required package: splines
Loading required package: Matrix

Attaching package: 'fda'

The following object is masked from 'package:graphics':

    matplot

Loading required package: mgcv
Loading required package: nlme
This is mgcv 1.8-12. For overview type 'help("mgcv-package")'.
Loading required package: rpart

 Package ILS: Interlaboratory Study
 version 0.1.0 (built on 2016-05-22).
 Copyright Miguel A. Flores Sanchez 2016.


Attaching package: 'ILS'

The following object is masked from 'package:nlme':

    Glucose

> png(filename="/home/ddbj/snapshot/RGM3/R_CC/result/ILS/h.fqcs.Rd_%03d_medium.png", width=480, height=480)
> ### Name: h.fqcs
> ### Title: This function is used to compute the FDA Mandel's h statistic.
> ### Aliases: h.fqcs h.fqcs.default h.fqcs.lab.fqcd
>
> ### ** Examples
>
> library(ILS)
> data(TG)
> delta <- seq(from = 40 ,to = 850 ,length.out = 1000 )
> curves.fqcd <- lab.fqcd(TG, argvals = delta)
> fh <- h.fqcs(curves.fqcd)
> xlab <- "Temperature(Grade Celsius)"
> ylab <- "Mass (%)"
> main <- "Functional hi  Estimation"
> p <- fh$p
> plot(fh,main = main, xlab = xlab, ylab = ylab,col=1:p,ylim=c(-3,3))
> legend(10,3,paste("Lab",1:p),
+       col=1:p,lty=1,lwd=2,cex=0.7)
>
>
>
>
>
> dev.off()
null device
          1
>
 .
.