an R object (used to select the method). See details.
...
arguments passed to or from methods.
var.index
Scalar with the column number corresponding to the observed variable (the critical to quality variable).
Alternatively, a string with the name of a quality variable can be provided.
replicate.index
Scalar with the column number corresponding to the index each replicate.
material.index
Scalar corresponding to the replicated number.
laboratory.index
Scalar that defines the index number of each laboratory.
data.name
String specifying the name of the variable which appears on the plots.
If name is not provided, it is retrieved from the object.
alpha
The significance level (0.05 by default)
References
Wilrich Peter-T. (2013), Critical values of Mandel's h and k,
the Grubbs and the Cochram test statistic. Asta-Advances in Statistical Analysis, 97(1):1-10.
ASTM E 691 (1999), Standard practice for conducting an interlaboratory study
to determine the precision of a test method. American Society for Testing and Materials. West Conshohocken, PA, USA.
R version 3.3.1 (2016-06-21) -- "Bug in Your Hair"
Copyright (C) 2016 The R Foundation for Statistical Computing
Platform: x86_64-pc-linux-gnu (64-bit)
R is free software and comes with ABSOLUTELY NO WARRANTY.
You are welcome to redistribute it under certain conditions.
Type 'license()' or 'licence()' for distribution details.
R is a collaborative project with many contributors.
Type 'contributors()' for more information and
'citation()' on how to cite R or R packages in publications.
Type 'demo()' for some demos, 'help()' for on-line help, or
'help.start()' for an HTML browser interface to help.
Type 'q()' to quit R.
> library(ILS)
Loading required package: multcomp
Loading required package: mvtnorm
Loading required package: survival
Loading required package: TH.data
Loading required package: MASS
Attaching package: 'TH.data'
The following object is masked from 'package:MASS':
geyser
Loading required package: depthTools
Loading required package: fda.usc
Loading required package: fda
Loading required package: splines
Loading required package: Matrix
Attaching package: 'fda'
The following object is masked from 'package:graphics':
matplot
Loading required package: mgcv
Loading required package: nlme
This is mgcv 1.8-12. For overview type 'help("mgcv-package")'.
Loading required package: rpart
Package ILS: Interlaboratory Study
version 0.1.0 (built on 2016-05-22).
Copyright Miguel A. Flores Sanchez 2016.
Attaching package: 'ILS'
The following object is masked from 'package:nlme':
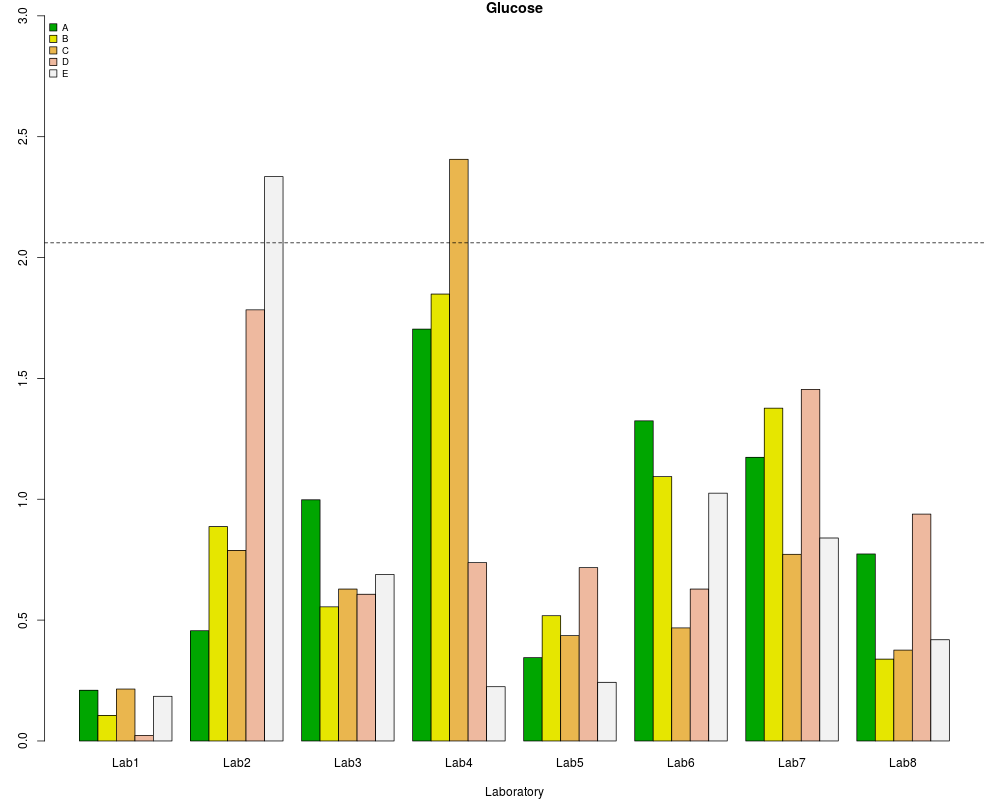
Glucose
> png(filename="/home/ddbj/snapshot/RGM3/R_CC/result/ILS/k.qcs.Rd_%03d_medium.png", width=480, height=480)
> ### Name: k.qcs
> ### Title: Function to calcute the Mandel's k statistic
> ### Aliases: k.qcs k.qcs.default k.qcs.lab.qcd
>
> ### ** Examples
>
>
> library(ILS)
> data(Glucose)
> Glucose.qcd <- lab.qcd(Glucose)
> str(Glucose.qcd)
Classes 'lab.qcd' and 'data.frame': 120 obs. of 4 variables:
$ x : num 41 41.5 41.4 41.2 42 ...
$ replicate : num 1 2 3 1 2 3 1 2 3 1 ...
$ material : chr "A" "A" "A" "A" ...
$ laboratory: chr "Lab1" "Lab1" "Lab1" "Lab2" ...
- attr(*, "data.name")= chr "Glucose"
> k<- k.qcs(Glucose.qcd, alpha = 0.005)
> summary(k)
Summary of material statistics:
NULL
Number of laboratories: 8
Number of materials: 5
Number of replicate: 3
Critical value: 2.06084
Beyond limits of control:
A B C D E
Lab1 TRUE TRUE TRUE TRUE TRUE
Lab2 TRUE TRUE TRUE TRUE FALSE
Lab3 TRUE TRUE TRUE TRUE TRUE
Lab4 TRUE TRUE FALSE TRUE TRUE
Lab5 TRUE TRUE TRUE TRUE TRUE
Lab6 TRUE TRUE TRUE TRUE TRUE
Lab7 TRUE TRUE TRUE TRUE TRUE
Lab8 TRUE TRUE TRUE TRUE TRUE
> plot(k)
>
>
>
>
>
> dev.off()
null device
1
>
 .
.