Generic function to plot objects of 'lab.fqcd' class
Usage
## S3 method for class 'lab.fqcd'
plot(x, main = NULL, xlab = NULL, ylab = NULL,
  ylim = NULL, x.co = NULL, y.co = NULL, legend = TRUE, col = NULL,
  ...)
Arguments
x
Object lab.fqcd (Functional Quality Control Data)
main
Main title for the plot
xlab
Title for the x axis
ylab
Title for the y axis
ylim
The y limits of the plot
x.co
It speficies the x co-ordinates to be used to place a legend.
y.co
It specifies the y co-ordinates to be used to place a legend.
legend
Logical argument. Default is TRUE then The legend default is used.
col
Color specifications
...
Arguments to be passed to or from methods.
References
Febrero-Bande, M. and Oviedo, M. (2012),
"Statistical computing in functional data analysis: the R package fda.usc". Journal of Statistical Software 51 (4), 1-28.
Naya, S., Tarrio-Saavedra. J., Lopez- Beceiro, J., Francisco Fernandez, M., Flores, M. and Artiaga, R. (2014),
"Statistical functional approach for interlaboratory studies with thermal data". Journal of Thermal Analysis and Calorimetry, 118,1229-1243.
R version 3.3.1 (2016-06-21) -- "Bug in Your Hair"
Copyright (C) 2016 The R Foundation for Statistical Computing
Platform: x86_64-pc-linux-gnu (64-bit)
R is free software and comes with ABSOLUTELY NO WARRANTY.
You are welcome to redistribute it under certain conditions.
Type 'license()' or 'licence()' for distribution details.
R is a collaborative project with many contributors.
Type 'contributors()' for more information and
'citation()' on how to cite R or R packages in publications.
Type 'demo()' for some demos, 'help()' for on-line help, or
'help.start()' for an HTML browser interface to help.
Type 'q()' to quit R.
> library(ILS)
Loading required package: multcomp
Loading required package: mvtnorm
Loading required package: survival
Loading required package: TH.data
Loading required package: MASS
Attaching package: 'TH.data'
The following object is masked from 'package:MASS':
geyser
Loading required package: depthTools
Loading required package: fda.usc
Loading required package: fda
Loading required package: splines
Loading required package: Matrix
Attaching package: 'fda'
The following object is masked from 'package:graphics':
matplot
Loading required package: mgcv
Loading required package: nlme
This is mgcv 1.8-12. For overview type 'help("mgcv-package")'.
Loading required package: rpart
Package ILS: Interlaboratory Study
version 0.1.0 (built on 2016-05-22).
Copyright Miguel A. Flores Sanchez 2016.
Attaching package: 'ILS'
The following object is masked from 'package:nlme':
Glucose
> png(filename="/home/ddbj/snapshot/RGM3/R_CC/result/ILS/plot.lab.fqcd.Rd_%03d_medium.png", width=480, height=480)
> ### Name: plot.lab.fqcd
> ### Title: Plotting method for 'lab.fqcd' objects
> ### Aliases: plot.lab.fqcd
>
> ### ** Examples
>
> library(ILS)
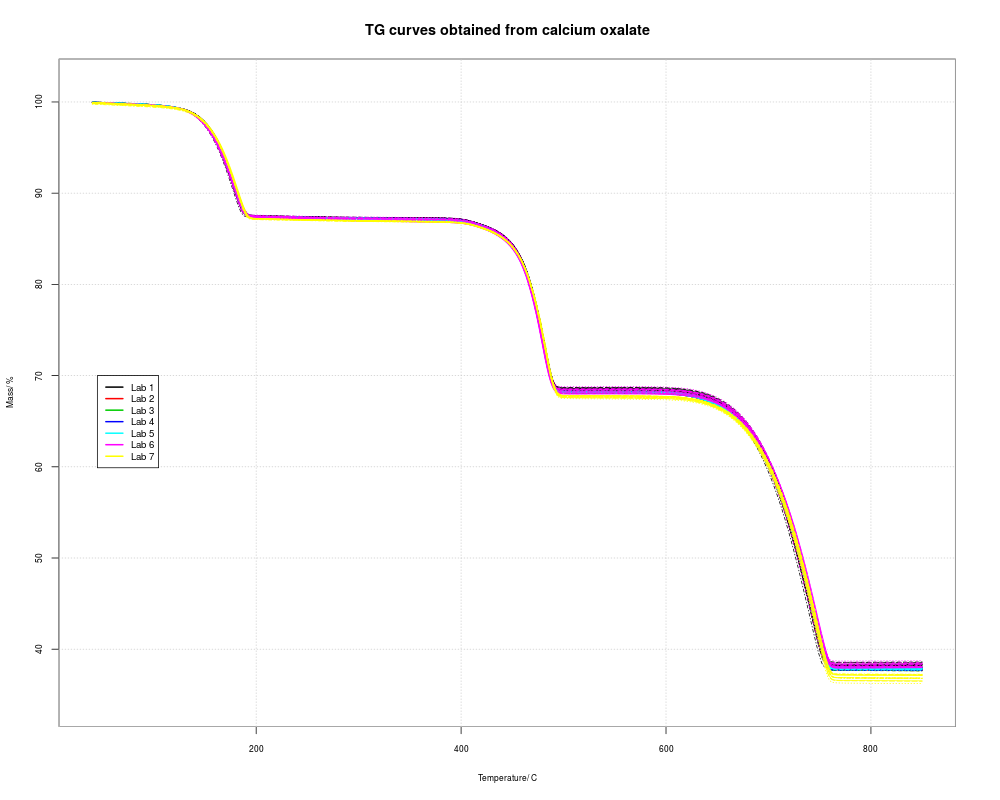
> data(TG)
> delta <- seq(from = 40 ,to = 850 ,length.out = 1000 )
> curves.fqcd <- lab.fqcd(TG, argvals = delta)
> xlab <- "Temperature/ C"
> ylab <- "Mass/ %"
> main <- "TG curves obtained from calcium oxalate"
> p <- dim(curves.fqcd$curves)[3]
> col <- 1:p
> plot(x = curves.fqcd, main, xlab, ylab, col= col,legend = FALSE)
> legend(45,70,paste("Lab",col),
+ col = col, lty = 1, lwd = 2, cex =0.8)
>
>
>
>
>
>
> dev.off()
null device
1
>
 .
.